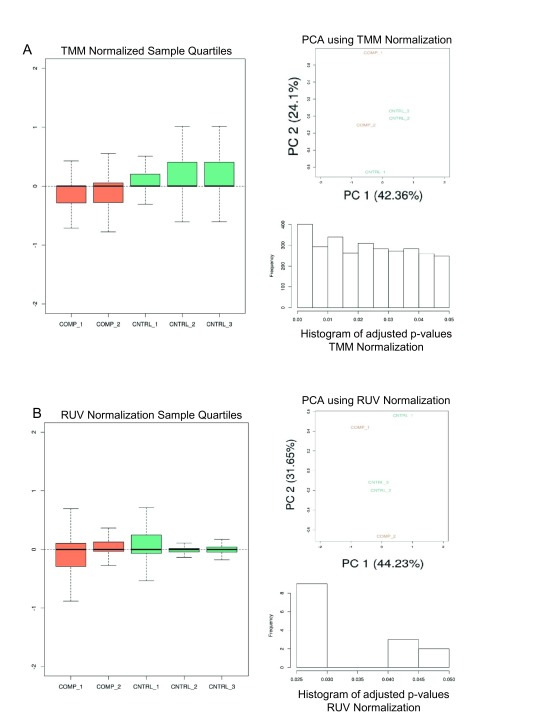
Figure 2. Arkas-Analysis Normalization Report: Normalization Analysis Using TMM and RUV.
A) TMM normalization is performed on sample data and depicts the sample quantiles on normalized sample expression, PCA plot, and histogram of the adjusted p-values calculated from the DE analysis. Orange is the comparison group and green is the control group. B) A similar analysis is performed with RUV in-silico normalization.

