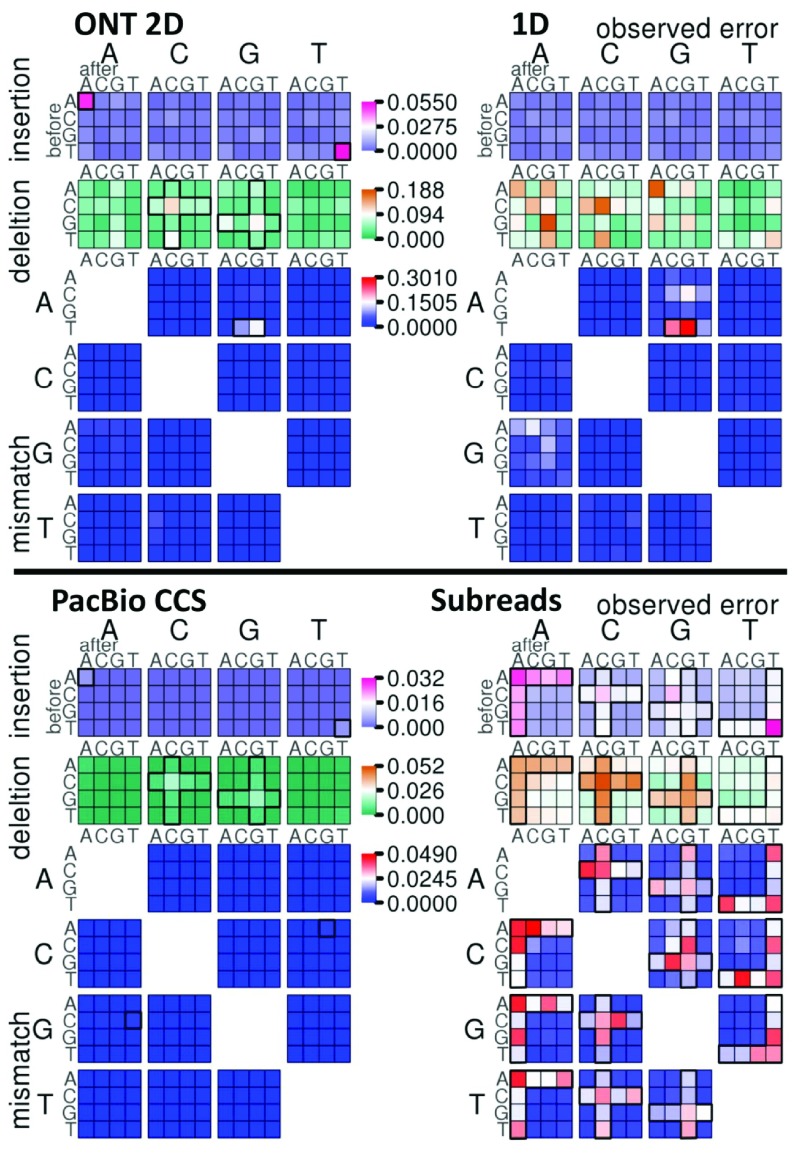
Figure 3. Context-specific errors.
Context specific-errors are shown for Oxford Nanopore Technologies (ONT) 2D and 1D reads (top), and Pacific Biosciences (PacBio) CCS and subreads (bottom). The error types shown are insertions, deletions and mismatches. For insertions, the large base above the plot indicates the inserted base, and for deletions, the deleted base. For mismatch errors, the large base to the left indicates the expected reference base, and the large base above indicates the base observed in the read. A block of color tiles shows the error frequency within specific contexts for each error; the small base to the left of the tiles indicates the base preceding the error, and the small base above is the base following error. Error frequency is plotted on separate scales for insertions, deletions, and mismatches. Homopolymer error patterns are highlighted with a bold cross- or L-shaped outlines in the ONT 2D, PacBio CCS and PacBio Subreads plots. Context-specific insertions and mismatches of interest in the ONT 1D, 2D and PacBio CCS reads are highlighted by a bold outlines. For a better contrast of lower error rate in PacBio CCS reads and ONT 2D reads, Supplementary Figure S4 displays each result with its own scale.

