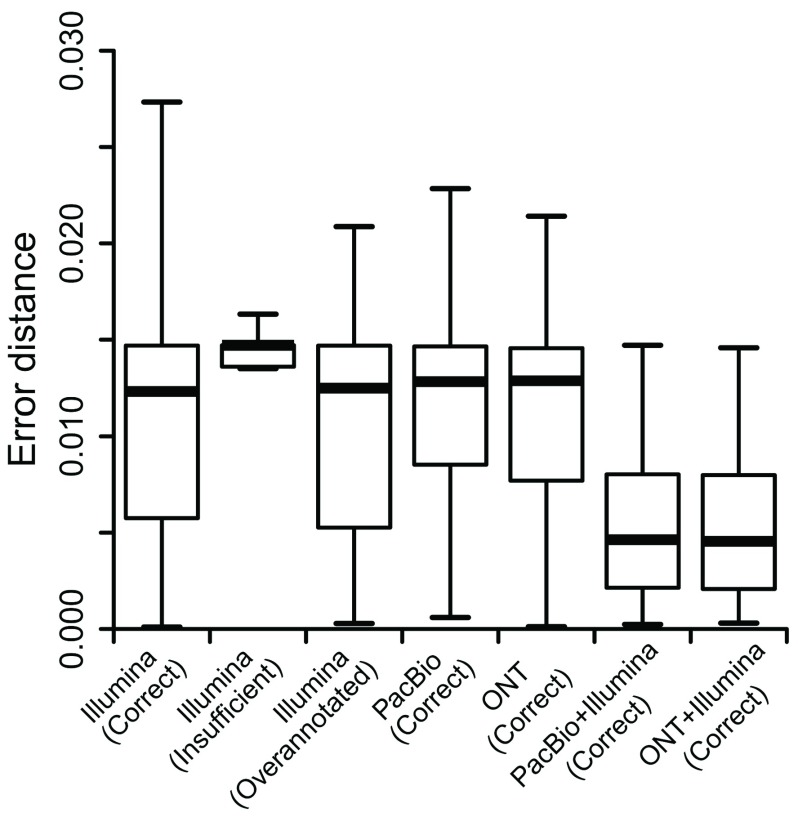
Figure 5. Estimation errors of isoform abundance estimation in Spike-in RNA Variant data.
The X axis shows 7 strategies. The label “correct”, “insufficient” and “over-annotated” in parentheses represent three different SIRV annotation libraries, respectively. The Y axis shows the euclidean distance between real relative expression percentage (1/68≈0.15) and estimated relative expression percentage (for more details see Methods). ONT: Oxford Nanopore Technologies; PacBio: Pacific Biosciences.

