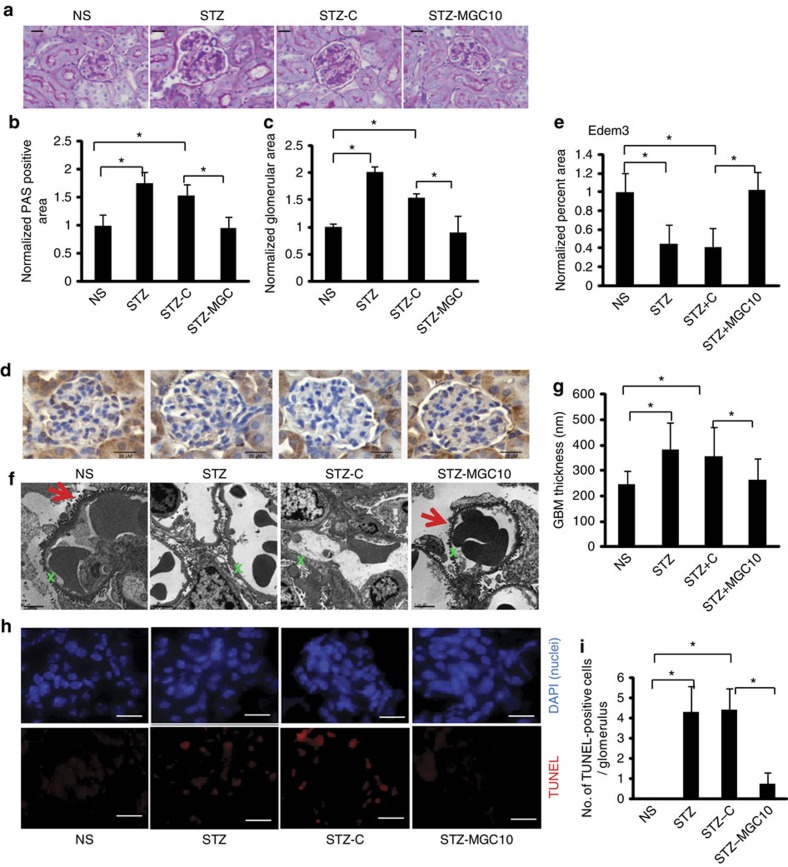
Figure 7. In vivo effects of MGC10 on kidney pathology in diabetic mice.
(a) PAS staining of kidney sections. Scale bar, 20 μm. (b,c) PAS positive area (b) and glomerular area (c) were significantly increased in diabetic mice (STZ and STZ-C) compared with non-diabetic mice (NS), and these were attenuated in diabetic mice injected with Gapmer targeting lnc-MGC, MGC10 (STZ-MGC10). (d) Edem3 staining in kidney sections. Scale bar, 20 μm. (e) Edem3 staining in kidney glomeruli was significantly decreased in diabetic mice (STZ and STZ+C) compared with non-diabetic mice (NS), and this was reversed in diabetic mice injected with MGC10 (STZ+MGC10). *P<0.05. (f) EM structures of glomeruli. Distorted podocyte structure and increased GBM thickness were observed in glomeruli from diabetic mice as well as in diabetic mice injected with negative control GapmeR (STZ and STZ+C), but these features were attenuated in diabetic mice injected by GapmeR targeting lnc-MGC (STZ+MGC10). Red arrows denote intact podocytes. Green Xs denote a section of GBM. Scale bar, 2 μm. (g) GBM thickness was significantly increased in diabetic mice (STZ and STZ-C) compared with non-diabetic mice (NS), and this was attenuated in diabetic mice injected with MGC10 (STZ-MGC10). *P<0.05. (h) TUNEL assay. Top panels, 4,6-diamidino-2-phenylindole staining (blue) showing nuclei; second, TUNEL (red). × 400 magnification. (i) Significant increase of TUNEL-positive cells was observed in diabetic mice (STZ and STZ-C) compared with non-diabetic mice (NS), and this was attenuated in diabetic mice injected with MGC10 (STZ-MGC10). *P<0.05. Scale bar, 20 μm.

