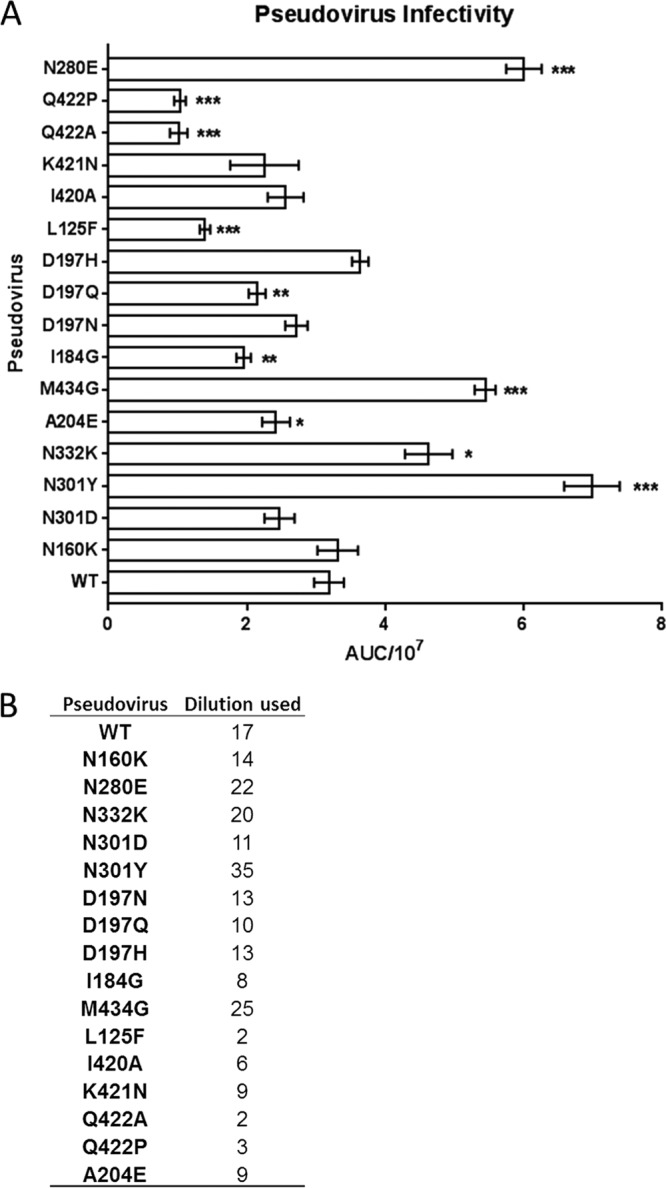
FIG 3.

Pseudovirus infectivity. (A) Pseudoviruses were titrated on TZM-bl cells as described previously (61). Replicate titration curves were used to calculate the area under the concentration/time curve (AUC) values using GraphPad Prism. The values were divided by 107. The asterisks indicate increasing degrees of significant (*, 0.05 > P > 0.01; **, 0.01 > P > 0.001; ***, P < 0.001) changes from the WT as determined by 2-tailed Student's t test. (B) Using the titration curves, the appropriate pseudovirus dilutions needed to achieve ∼150,000 RLU were interpolated.
