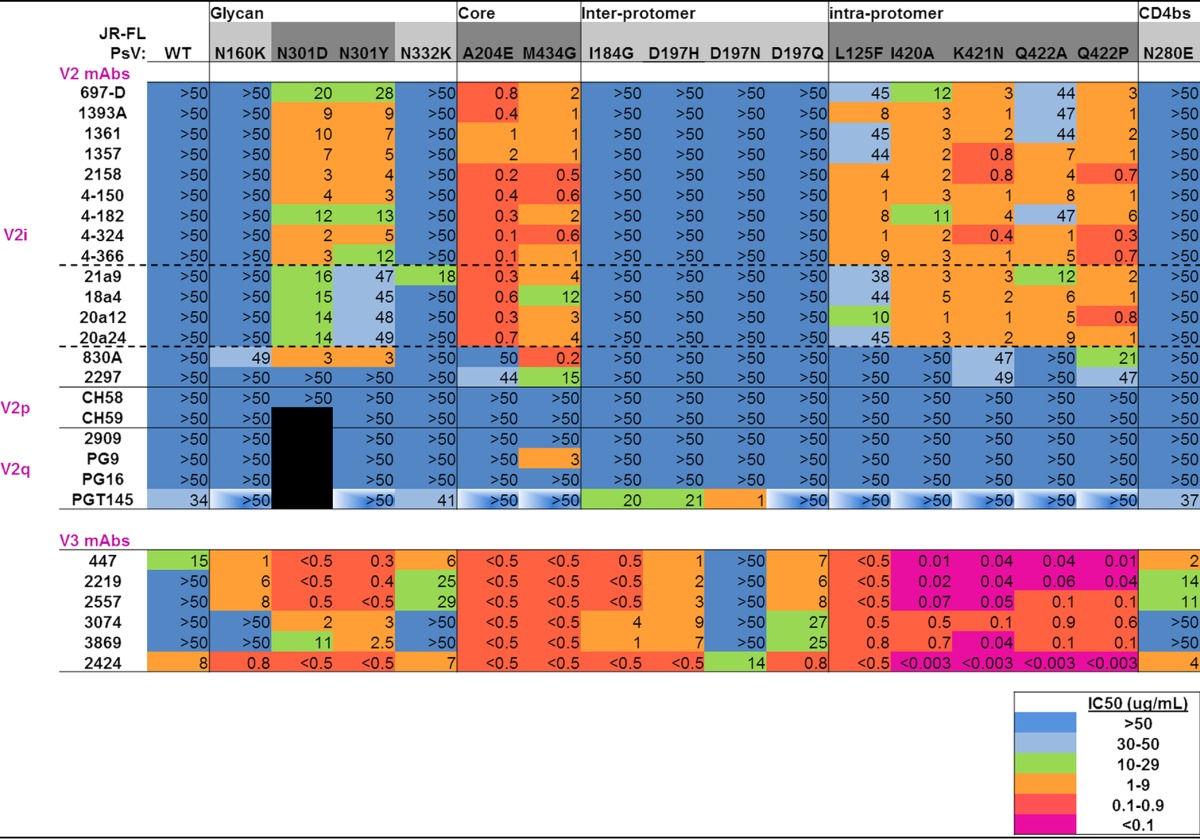
TABLE 1.
Sensitivities of mutant pseudoviruses to V2- and V3-specific MAbsa

The titles at the top of the table indicate the types of interactions in the Env trimer affected by the mutations listed directly below. JR-FL WT and mutant pseudoviruses (PsV) are shown in the next row across the table. Mutants shaded in dark gray indicate neutralizing sensitivity to V2 and V3 MAbs compared to the WT, while mutants shaded in light gray show neutralization sensitivity to V3 MAbs but not V2 MAbs. IC50s are shown and were calculated by titration of MAbs in the TZM-bl assay, as detailed in Materials and Methods. “>50” (blue shading) indicates that 50% neutralization was not achieved even at the highest MAb concentration tested, 50 μg/ml. Increasing neutralization sensitivity is indicated by color coding, as shown in the color legend. The black boxes indicate that experiments were not done. The boxes with partial white shading indicate decreased neutralization sensitivity. The solid horizontal lines separate classes of MAbs, whereas the dashed horizontal lines indicate subdivisions with the V2i family of MAbs.
