Fig. 5.
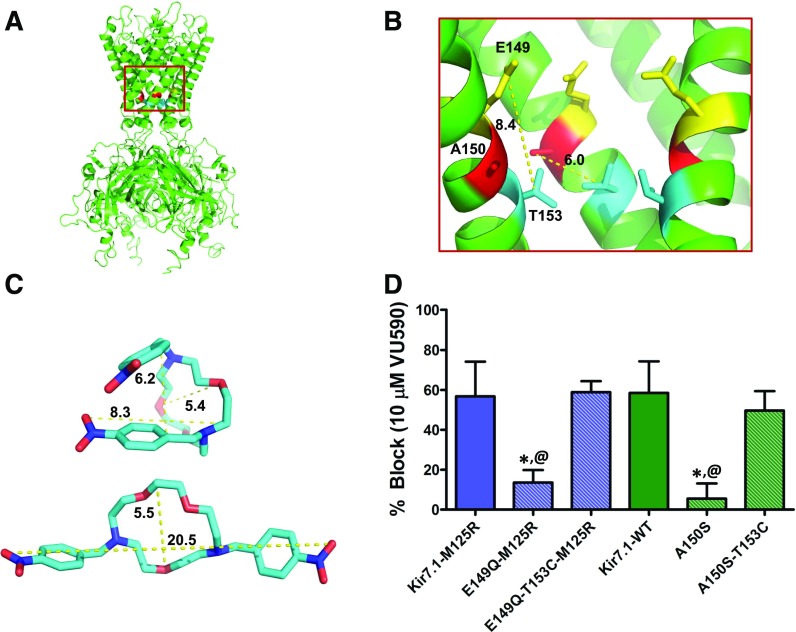
The T153C mutation restores block of Kir7.1 binding-site mutants. (A) Kir7.1 homology model showing relative positions of E149, A150, and T153 residues. (B) Magnified section of the Kir7.1 homology model (red square in (A)) shows relative distances (in angstroms) between the E149 (yellow), A150 (red), and T153 (blue) residues. (C) Representative conformations of VU590 in either folded or extended states. (D) Mean ± S.D. percent inhibition by 10 μM VU590. *P < 0.05, statistically significantly different from the respective control background (Kir7.1-WT or Kir7.1-M125R). Data were analyzed using one-way ANOVA with Bonferroni’s multiple comparison test. @P < 0.05 statistically significantly different from respective T153C mutants, n ≥ 5.

