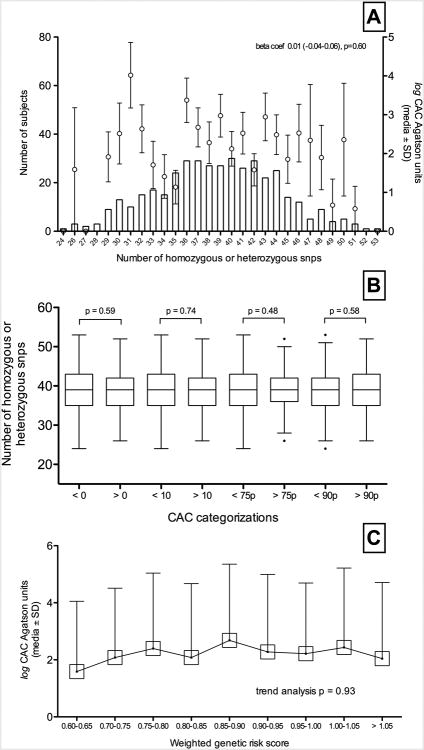
Figure 1.
Panel A shows log coronary artery calcification (CAC) (mean and standard deviation -SD- Agatston units, right axis) relation with number of coronary artery disease related SNPs (left axis). Panel B shows number of CAD related SNPs (Tukey's bloxplots) in every CAC categorization - CAC higher than 0 and 10 Agatston units and higher than percentile 75th and 90th; ‘p’ values of the difference in every categorization is showed. Panel C depicts a trend analysis of log CAC (mean and SD) and its relation with the weighted genetic risk score.

