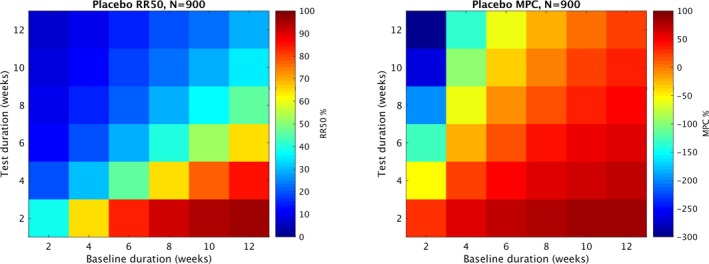
Figure 2.

Expected values of placebo RR50 and MPC. Each grid location represents the average value (RR50 or MPC) in the placebo arm of 1000 trials with identical parameters. All trials used number of patients (N) = 900, percentage of patients that drop out (dropout) = 0, and minimum monthly seizure rate during baseline required for inclusion (min) = 4. The different grid locations represent different combinations of baseline weeks (B) and test weeks (T) values for the trial duration. RR50 and MPC were both correlated with B and inversely correlated with T. Note that the color scales differ in the MPC figure and the RR50 figure. The lowest values of RR50 correspond to the most negative values of MPC.
