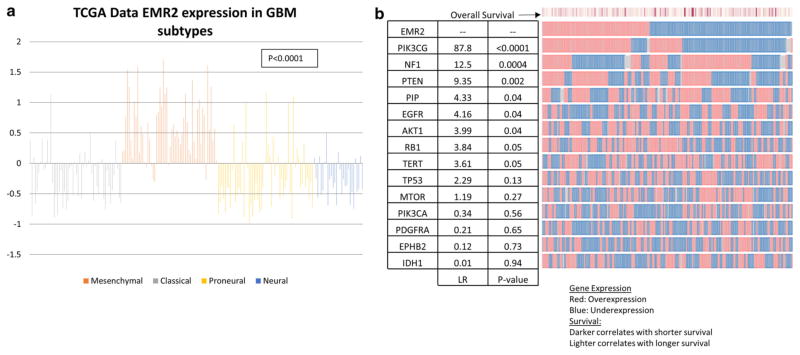
Fig. 2.
a Plot of EMR2 expression in each glioblastoma subtype using z-score values from TGCA database queried in April 2014. Mesenchymal subtype shows the most consistent up-regulation of EMR2. b OncoPrint plot generate by TCGA database showing tumors with up-regulation and down regulation of EMR2 and other significant genes of glioblastoma subtypes and the AKT/PTEN/PI3K pathway. Likelihood ratio of each genes association with the up/down expression of EMR2

