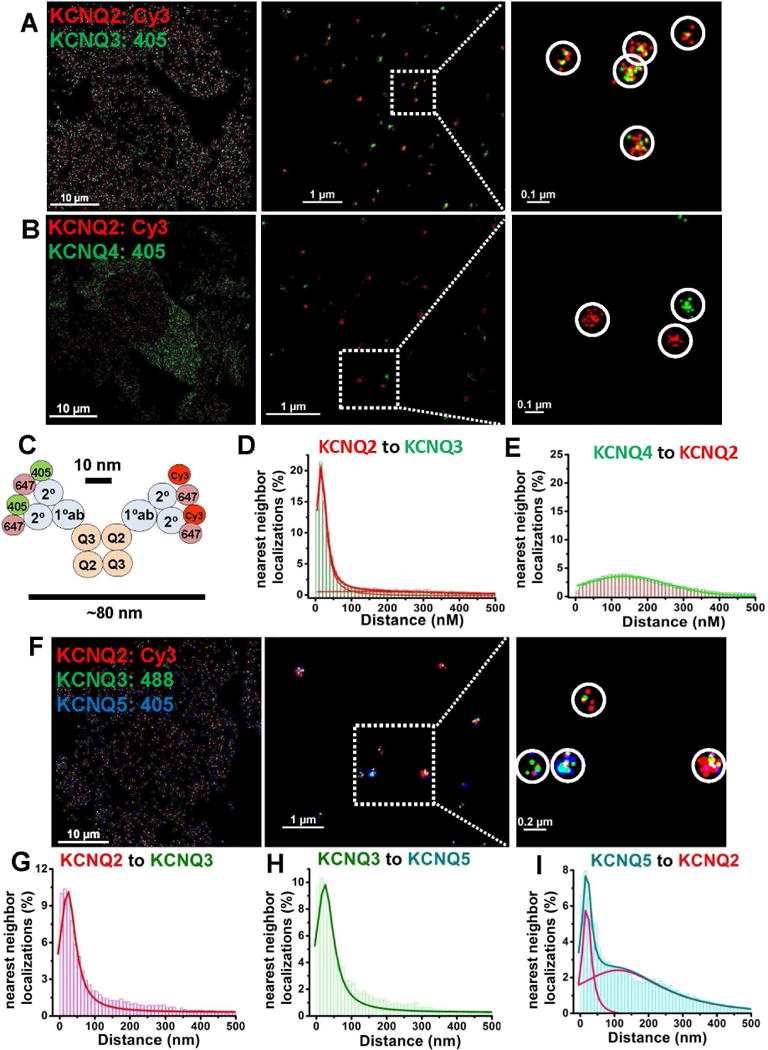
Figure 1. STORM distinguishes proteins between those that are, or are not, intimately associated.

CHO cells were co-transfected with KCNQ2+KCNQ3 (A), KCNQ2+KCNQ4 (B), or with KCNQ2+KCNQ3+ KCNQ5 (F) at low density, and labeled with primary antibodies then secondary antibodies conjugated with Alexa405/Alexa647, Cy3/Alexa647 or Alexa 488/Alexa647 dye pairs, as indicated. (A) KCNQ2/3 heteromers are visualized as clusters of localizations of two different colors, or (B) KCNQ2 and KCNQ4 homomers visualized as separate clusters of localizations of the same color under double-label STORM. (C) Co-localization scheme predicting approximate cluster size for cells labeling KCNQ2/3 heteromers using primary and secondary antibodies under STORM. (D–E) Nearest-neighbor distances for cells co-transfected with KCNQ2+KCNQ3 (D) or KCNQ2+KCNQ4 (E). (F) Shown are images of cells co-transfected with KCNQ2+KCNQ3+KCNQ5 under triple-label STORM, showing clusters of localizations representing several types of heteromeric channels. (G–I) For cells as in F, shown are histograms of nearest-neighbor distances for KCNQ2-KCNQ3 localizations (G), KCNQ3-KCNQ5 localizations (H), or KCNQ5-KCNQ2 localizations (I). (n= 5, 4, and 5 cells for analyses in D, E, and G–I, respectively). Other nearest-neighbor histograms can be found in Figure S2. Detailed information about the fitted curves is described in Table S1 and their cluster analysis in Figure S3.
