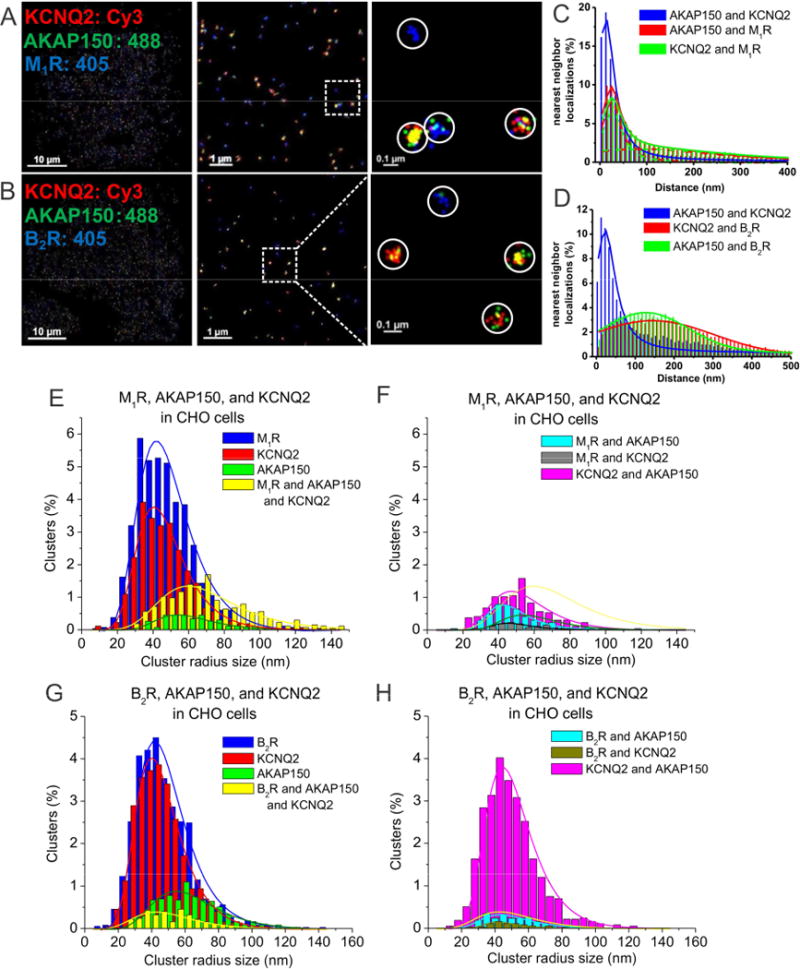
Figure 4. AKAP150 complexes with M-channels and G protein-coupled receptors observed by STORM in CHO cells.

(A–B) STORM images of CHO cells co-transfected and triple-labeled with KCNQ2, AKAP150 and (A) M1, or (B) B2 receptors. The images show intimate association of KCNQ2 with AKAP150 and M1 receptors, but not B2 receptors. (C) Plotted are nearest-neighbor distances for AKAP150-KCNQ2, AKAP150-M1R and KCNQ2-M1R. n= 4 cells. (D) Plotted are nearest-neighbor distances for AKAP150-KCNQ2, AKAP150-M1R and AKAP150-B2R. n= 8 cells. (E–F) Plotted are histograms of analysis of cluster radii of M1R, AKAP150, and KCNQ2-labeled localizations for images such as in A, C. Seen in F, M1R-AKAP150 clusters and M1R-KCNQ2 clusters are interpreted as under the “noise floor.” (G–H) Plotted are histograms of analysis of cluster radii of B2R, AKAP150, and KCNQ2-labeled localizations. Seen in H, clusters representing KCNQ2-AKAP150, B2R/AKAP150 and B2R/KCNQ2 complexes, with the latter two are interpreted as being below the noise floor.
