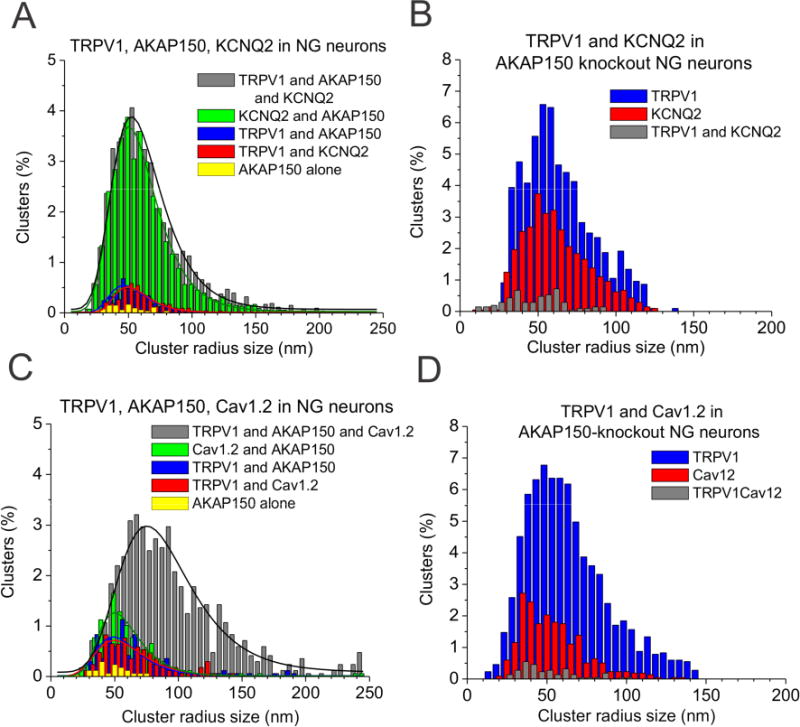
Figure 8. Cluster distribution of STORM localizations of AKAP150-coupled to TRPV1 and KCNQ2 or TRPV1 and Cav1.2 in NG neurons.

(A) Plotted are histograms of cluster radii of WT NG neurons triple-labeled for TRPV1, AKAP150, and KCNQ2, for the data as in Figs. 6A&E, or (B) TRPV1/KCNQ2 complexes in NG neurons from AKAP150 KO mice, for the data as in Figs. 6B&F. Clusters representing TRPV1/KCNQ2 complexes in AKAP150 KO neurons were under the noise floor. (C) Plotted are histograms of cluster radii for WT NG neurons triple-labeled for TRPV1, AKAP150, and Cav1.2, for the data as in Figs. 7A&C or (D) Cav1.2/TRPV1 complexes in NG neurons from AKAP150 KO mice, for the data as in Figs. 7B&D. Clusters representing TRPV1/Cav1.2 complexes in AKAP150 KO neurons were under the noise floor. Clusters representing isolated TRPV1 channels had a significantly right-shifted size distribution and mean compared with solo CaV1.2 clusters (see Table S5, p < 0.05).
