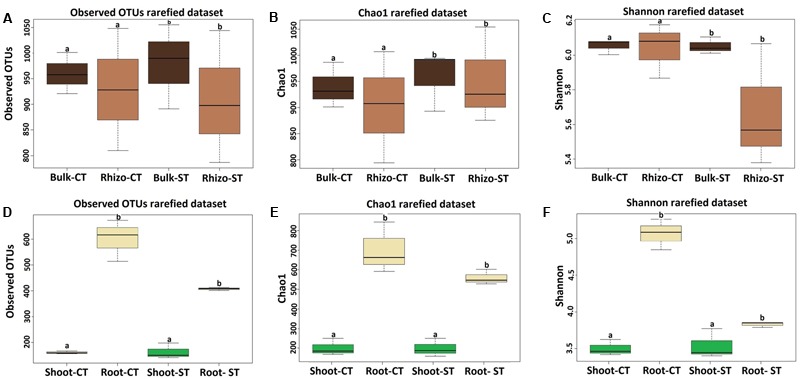
FIGURE 2.

Variation patterns of alpha diversities of the bacterial communities associated with bulk soil, rhizosphere, root and shoot under two tillage practices; CT and ST. The alpha diversity estimates; Total number of observed OTUs, Chao1 estimator and Shannon’s diversity of soil samples (bulk soil and rhizosphere) are displayed in (A–C) respectively, and of plant samples (root and shoot) are displayed in (D–F) respectively. Sequencing reads of soil samples and plant samples were rarefied at an even sequencing depth 6,191 and 9,765 reads/sample respectively prior the analysis. Lowercase letters denote statistically significant differences by Kruskal–Wallis and Dunn’s post hoc tests, P < 0.05, Benjamini–Hochberg (BH) corrected between the plant compartments within one tillage system. Statistical results of alpha diversity are displayed in Supplementary Excel File WS-1.
