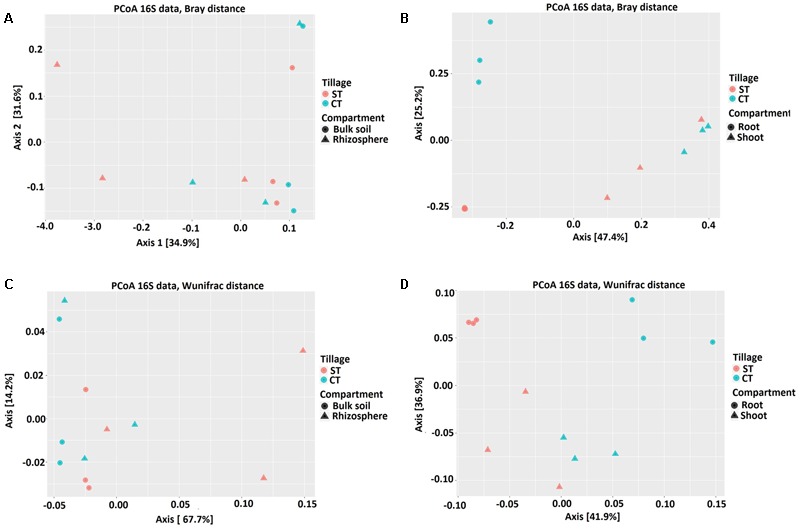
FIGURE 3.

Bacterial community structure of bulk soil, rhizosphere, root and shoot under CT and ST tillage practices. Principal Coordinate Analysis (PCoA) based on Bray-Curtis (BC) and Weighted UniFrac (WUF) distances calculated using counts per million transformed OTU abundances. Comparison between the soil samples; bulk soil and rhizosphere (A) BC (C) WUF under CT and ST. Comparison between the plant samples; root and shoot (B) BC (D) WUF under CT and ST. In both panels, colors define the tillage regimes, while shapes depict the indicated compartments. Statistical results of beta diversity are displayed in Supplementary Excel File WS-2.
