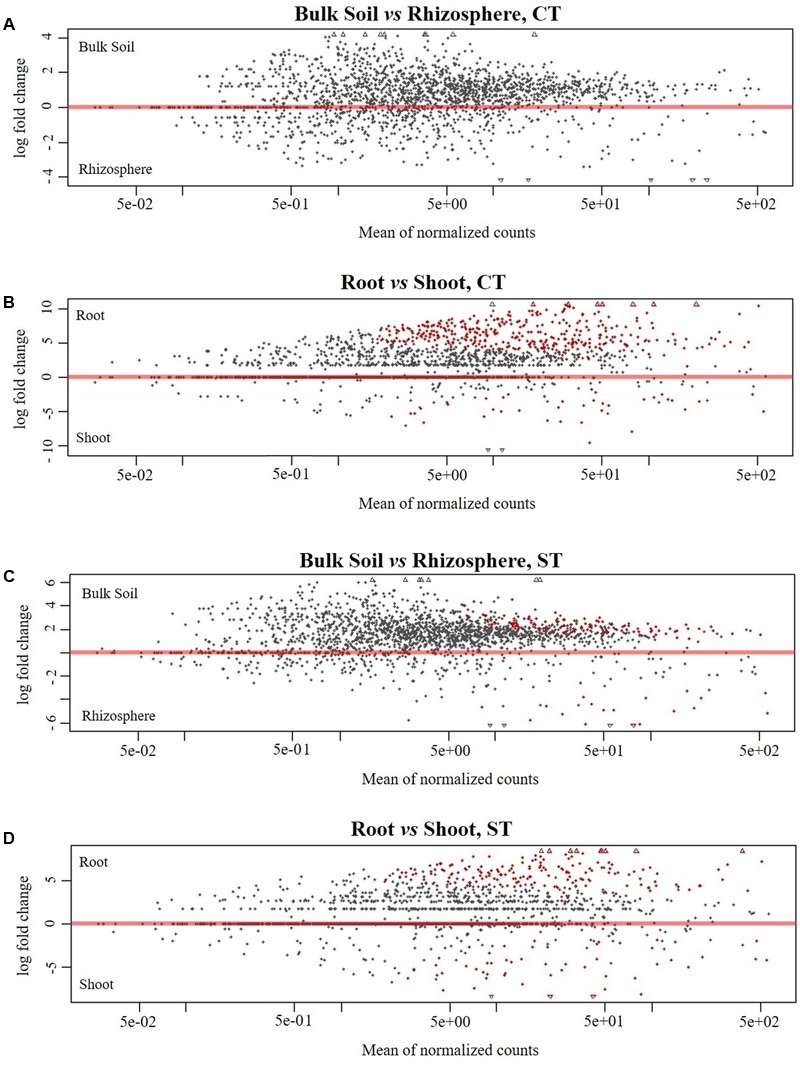
FIGURE 4.

Pair-wise comparisons of the compartments under tillage regimes for enriched OTUs. Comparison of bulk soil and rhizosphere under (A) CT (C) ST. Comparison of root and shoot under (B) CT (D) ST. In each plot, the shapes depict individual OTUs whose position on the x-axis reflect their abundance (normalized counts) and the position on the y-axis the fold change in the indicated comparison. The red color depicts OTUs whose abundance is significantly different in the indicated comparisons (Wald test, P < 0.05, FDR corrected). Taxonomy information of significantly enriched OTUs in each compartment under both tillage are displayed in Supplementary Excel File WS3–10.
