
Figure 4.
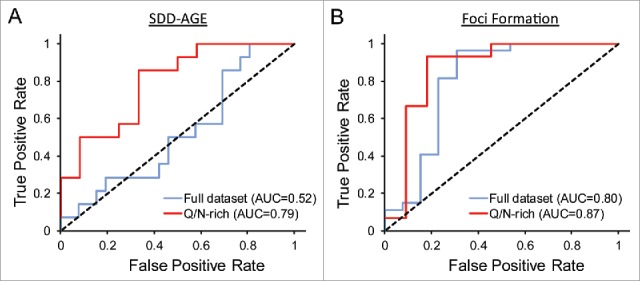
PAPA accuracy for the tested proteins. A) ROC plot examining the ability of PAPA to predict formation of SDS-insoluble aggregates. Among the full data set, PAPA shows almost no ability to distinguish between positive and negative examples (AUC = 0.52), but among the subset of domains with greater than 21% Q/N content, PAPA shows reasonably accurate predictions (AUC = 0.79). B) ROC plot examining the ability of PAPA to predict foci formation. For foci formation, PAPA shows roughly equivalent ability to distinguish between positive and negative examples among the full data set and for the Q/N-rich subset.