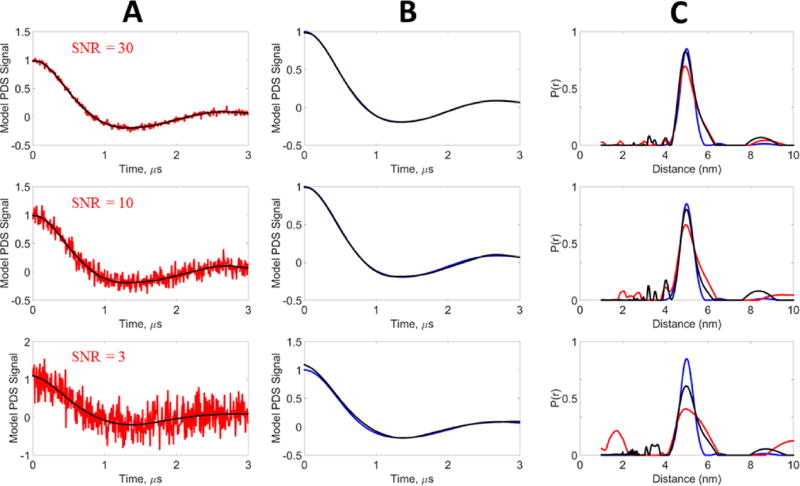
Figure 4.
Model data, unimodal distribution: blue, model signal (reference); red, noisy signal; black, WavPDS denoised signal. The model signal was generated from a Gaussian distribution centered at 5 nm with a standard deviation of 0.3 nm. White Gaussian noise was added to generate the noisy signals at SNRs 30, 10, and 3. (A) Comparison of noisy and denoised signals. (B) Comparison of the reference signal with the denoised signal obtained by WavPDS. (C) Distance distributions from noisy, denoised, and reference signals.

