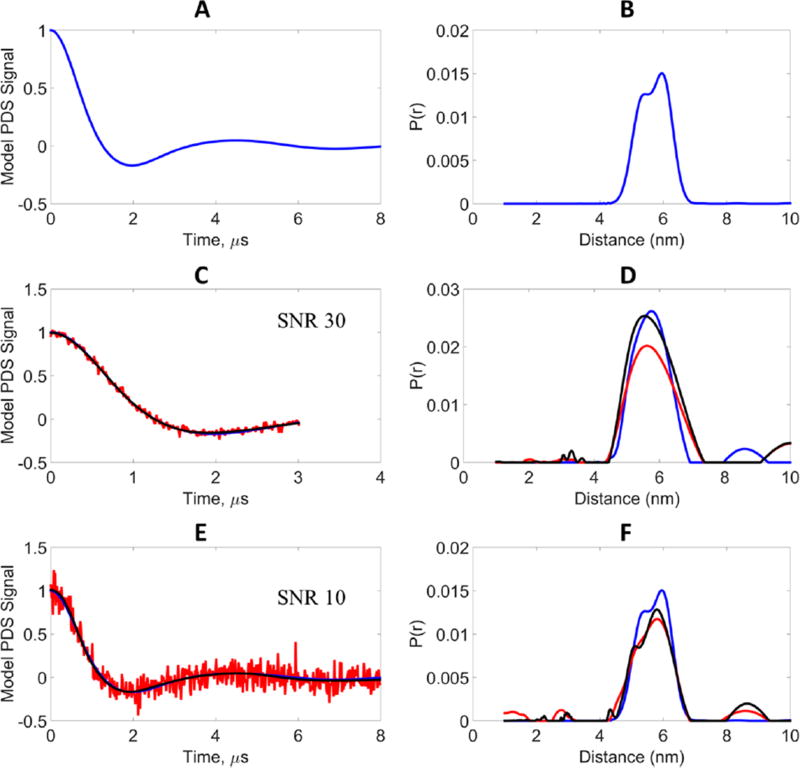
Figure 6.
Model data, results of longer evolution time at higher noise (low SNR) compared to shorter evolution time at lower noise (high SNR): blue, model signal (reference); red, noisy signal; black, WavPDS denoised signal. (A) Model signal at evolution time 8 µs generated from bimodal distance distribution. (B) Bimodal distance distribution generated from two Gaussian distributions centered at 5.3 and 6 nm, each with standard deviation 0.3 nm, and peak heights of 0.8 and 1, respectively. (C) Comparison of noisy, denoised, and Model signals at 3 µs evolution time for the bimodal distance distribution. (D) Distance distributions from noisy, denoised, and model signals at 3 µs evolution time. (E) Comparison of noisy, denoised, and model signals at 8 µs evolution time for the bimodal distance distribution. (F) Distance distributions from noisy, denoised, and model signals at 8 µs evolution time.

