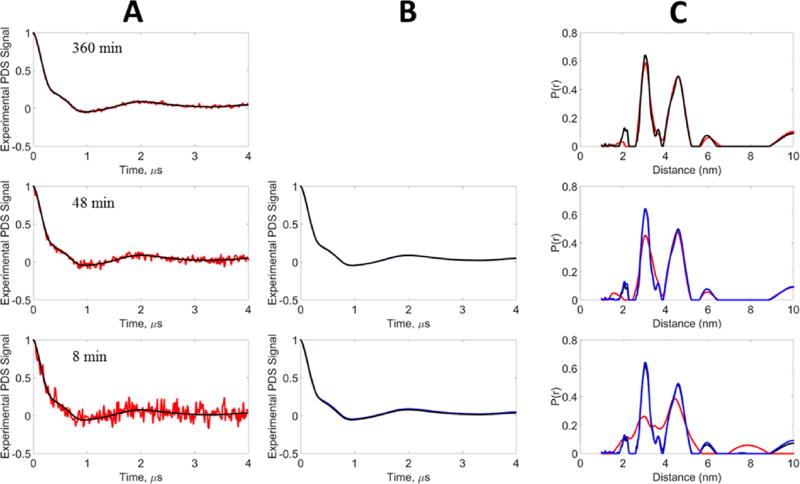
Figure 8.
Experimental data, bimodal distribution: blue, reference signal; red, noisy signal; black, WavPDS denoised signal. The experimental signal was generated from the T4 lysozyme spin-labeled admixture of mutants 8C/44C and 44C/135C at concentrations of 44 and 47 µM, respectively, at acquisition times 360, 48, and 8 min. (A) Comparison of noisy and denoised signals. (B) Comparison of denoised signals after WavPDS with reference. (C) Distance distributions from noisy, denoised, and reference signals. The denoised signal at 360 min was used as the Reference.

