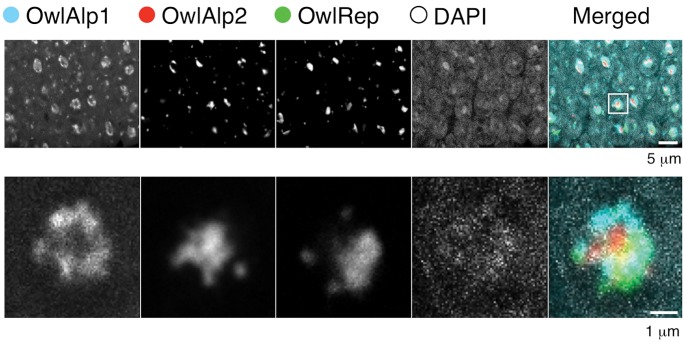
Fig. 3.—
Distribution of the three megasatellite DNAs. The upper panels show the distribution in the retina tissue. Photographs of multiple cross-sections along the z axis are shown in supplementary figure S1, Supplementary Material online, and layer 11 is shown here as an example. A typical single nucleus, indicated by the square in the merged photograph, was picked up and its magnified photographs are shown in the lower panels. Photographs of multiple cross-sections are shown in supplementary figure S2, Supplementary Material online.

