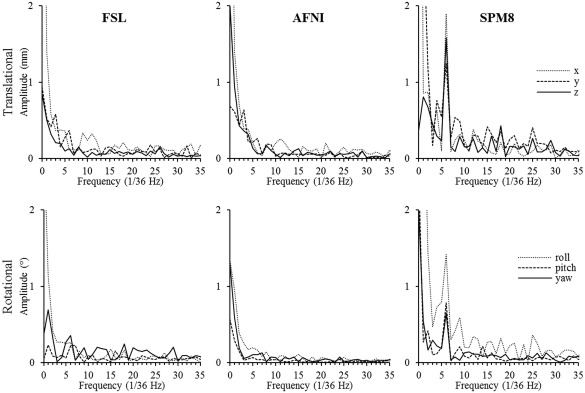
Figure 2.

Fourier‐transformed motion parameters for one of the high‐resolution scans of one of the subjects. The parameters are estimated by FSL (left), AFNI (mid), and SPM8 (right), and both translational (top) and rotational (bottom) are shown. Note the peak at the stimulation frequency (6/36 Hz) for SPM8.
