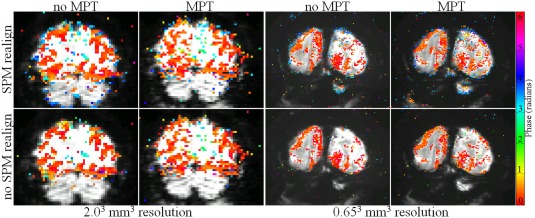
Figure 5.

Comparison of phase maps overlaid on averaged EPIs. False‐color coded phase‐map‐overlays onto one EPI‐plane obtained at spatial resolutions of 2.003 mm3 (left group of panels) and 0.65³ mm³ (right group of panels), for a coherence threshold of 0.40, corresponding to a significance level of P ≤ 0.00025. Data sets were preprocessed with or without retrospective realignment in SPM 8 (top and bottom rows correspondingly). The ones in the left column are without MPT‐based prospective motion correction; in the right with prospective motion correction. The color phase bar, phase of stimulation and driven response are encoded with orange–yellow. It should be noted that 1 π shifted (blue) responses are more evident after realignment, especially for 0.65³ mm³ resolution. [Color figure can be viewed at http://wileyonlinelibrary.com]
