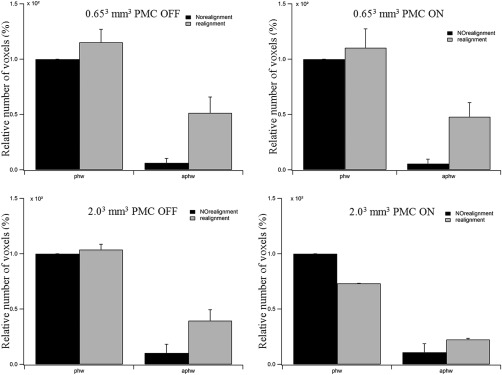
Figure 6.

Number of relative activated voxels in phase and antiphase windows (left and right pair in each graph) for data acquired with prospective motion correction (PMC) off (1st row) and on (2nd row) for low (left) and high (right) resolutions before (black bars) and after (white bars) retrospective motion realignment.
