
Figure 7.
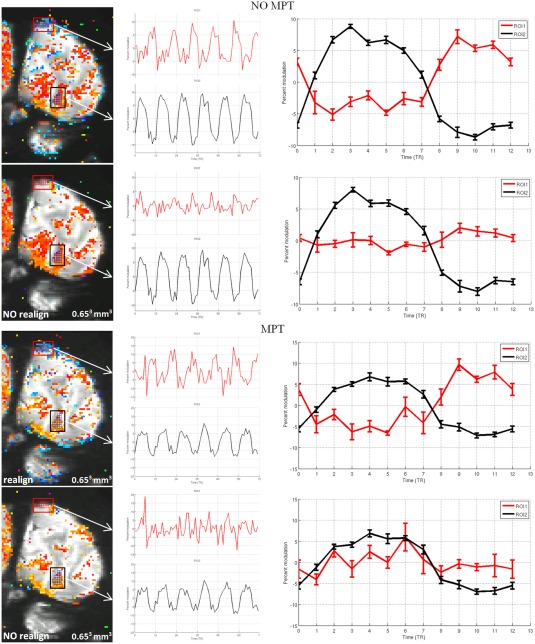
Time series (TS) comparison for high‐resolution data. In Rows 1 and 2, the phase maps generated from data without prospective motion correction by MPT were preprocessed with and without retrospective realignment by SPM 8, respectively; in Rows 3 and 4, the phase maps generated from functional data with prospective motion correction by MPT, preprocessed with and without realignment by SPM 8, respectively. Two regions of interest (ROI1 and ROI2) were defined on the activation map in Row 1. The TS of the two ROIs through cycles and average TS are plotted, respectively; threshold: 0.40, corresponding to a significance level of P ≤ 0.00025. [Color figure can be viewed at http://wileyonlinelibrary.com]