
Figure 8.
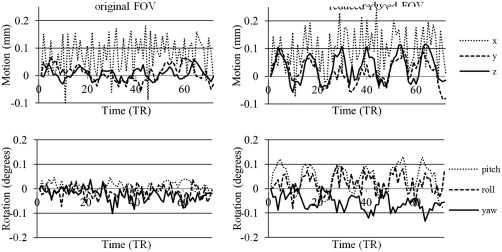
Motion‐realignment plots before (left) and after (right) reduction of FOV of low‐resolution 23 mm3 data for one of the subjects (translational (top) and rotational (bottom) motion).
Official websites use .gov
A
.gov website belongs to an official
government organization in the United States.
Secure .gov websites use HTTPS
A lock (
) or https:// means you've safely
connected to the .gov website. Share sensitive
information only on official, secure websites.
Motion‐realignment plots before (left) and after (right) reduction of FOV of low‐resolution 23 mm3 data for one of the subjects (translational (top) and rotational (bottom) motion).