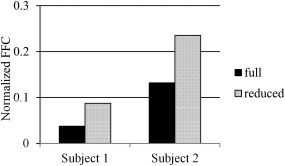
Figure 9.

Fourier analysis results of motion‐realignment parameters for subject 1 (left) and 2 (right). Full (solid black) is the original low‐resolution data and reduced (dotted) is the low‐resolution data with reduced FOV to match that of high‐resolution data. Values are normalized Fourier frequency components corresponding to stimulus frequency averaged over 4 scans (2 with PMC and 2 without PMC) and 6 parameters (translational and rotational).
