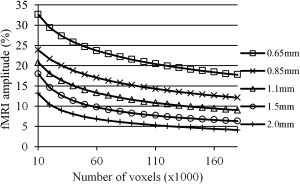
Figure 11.

Activation amplitude calculation for the original high‐resolution 0.653 mm3 and downsampled to 0.853, 1.13, 1.53, and 2.03 mm3 data. Amplitude is calculated by Stanford VISTA tools, and averages over varying number of maximum‐amplitude voxels are plotted for each resolution for one of the subjects.
