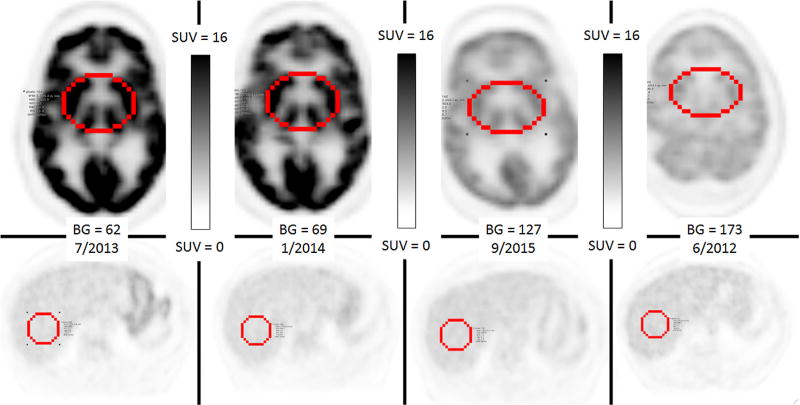
Fig. 3.
Axial images from the MIP images in Fig. 2 at that the level the ROI of the brain and liver were obtained. Similar to Fig. 2, each image is scaled identically between 0 and 16.0, with respect to Standardized uptake value (SUVkg). Again there is There is a significant decrease in brain FDG uptake associated with progressively increasing plasma glucose levels and subtle increased liver and blood-pool SUVkg.

