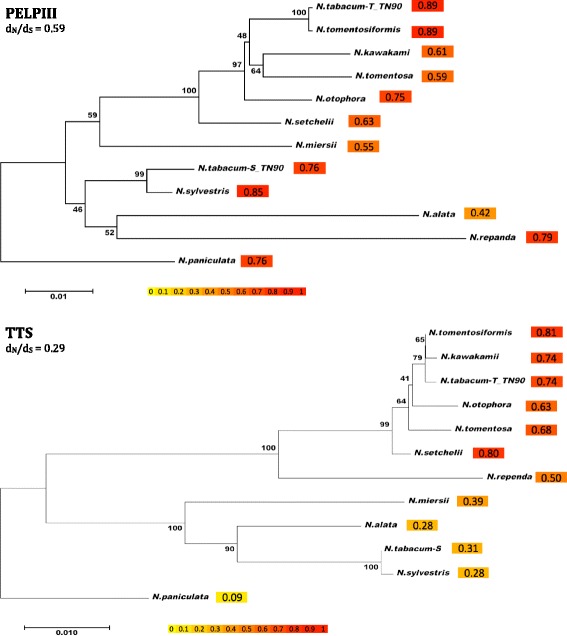
Fig. 5.

Estimate of the signatures of selection (dN/dS) in the PELPIII and TTS genes among selected Nicotiana spp. The evolutionary distances were computed using the Tamura-Nei method [79] and are in the units of the number of base substitutions per site. dn/ds ratios were calculated along each branch using the Nei-Gojobori method. The trees show negative selection (dn/ds < 1) in all branches. The color intensity indicates the dn/ds ratio. The evolutionary history was inferred using the Neighbor-Joining method [67] and the bootstrap test was performed for each tree (500 replicates; [21]). Bootstrap values are next to each node
