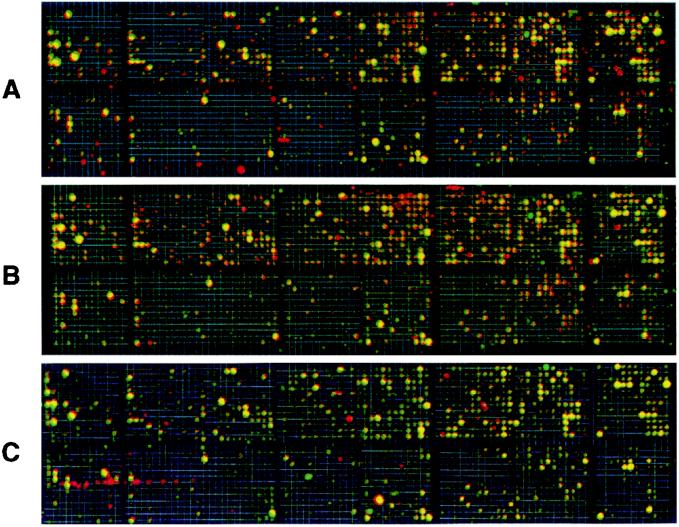
Figure 1.
Scanned phosphorimages of cDNA microarrays from RIα antisense ODN-treated cells and cells overexpressing the antisense gene, superimposed with images of respective control cells. (A) Antisense ODN-treated PC3 M cells. (B) Antisense gene overexpressing PC3 M cells. (C) LS-174T cells overexpressing the antisense gene. Genes up-regulated, compared with the control, are shown in red; down-regulated genes are shown in green, and yellow represents genes without changes in expression. The data represent one of four separate hybridizations that gave similar results.

