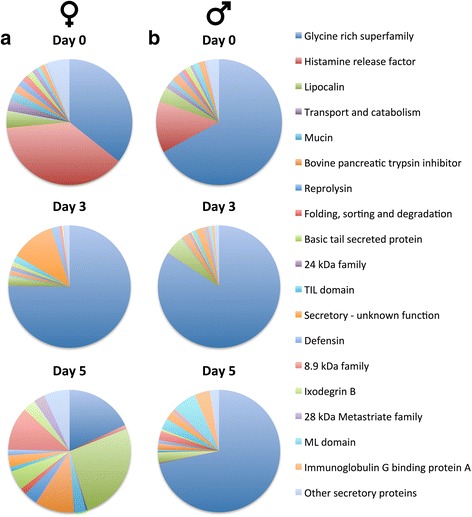
Fig. 3.

Expression proportions of the R. zambeziensis secretory protein families during feeding. The proportions of the highest contributing secretory protein families of female (a) and male (b) ticks at different feeding time points are indicated. Expression levels were measured by transcripts per million (TPM). Colour key representing the protein families is indicated. Expression values can be found in Additional file 1: Table S3
