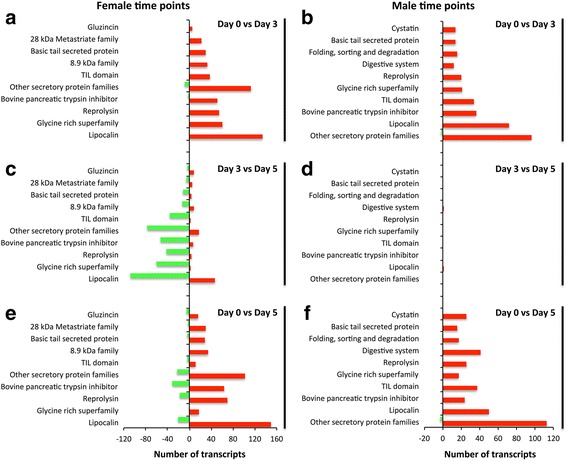
Fig. 5.

Differentially expressed transcripts of secretory protein families in R. zambeziensis. The numbers of up- (red colour) and downregulated (green) secretory protein transcripts, after pairwise comparisons between different feeding time points, are represented. Pairwise comparisons are shown for female: (a) day 0 vs day 3, (c) day 3 vs day 5 and (e) day 0 vs day 5; and male ticks: (b) day 0 vs day 3, (d) day 3 vs day 5 and (f) day 0 vs day 5. The pairwise comparisons are represented as a progression of feeding and show how transcript expression changed from the earlier to the later time point. The edgeR software package (fixed dispersion = 0.4, fold change > 4 and FDR P < 0.01) was used for differential expression
