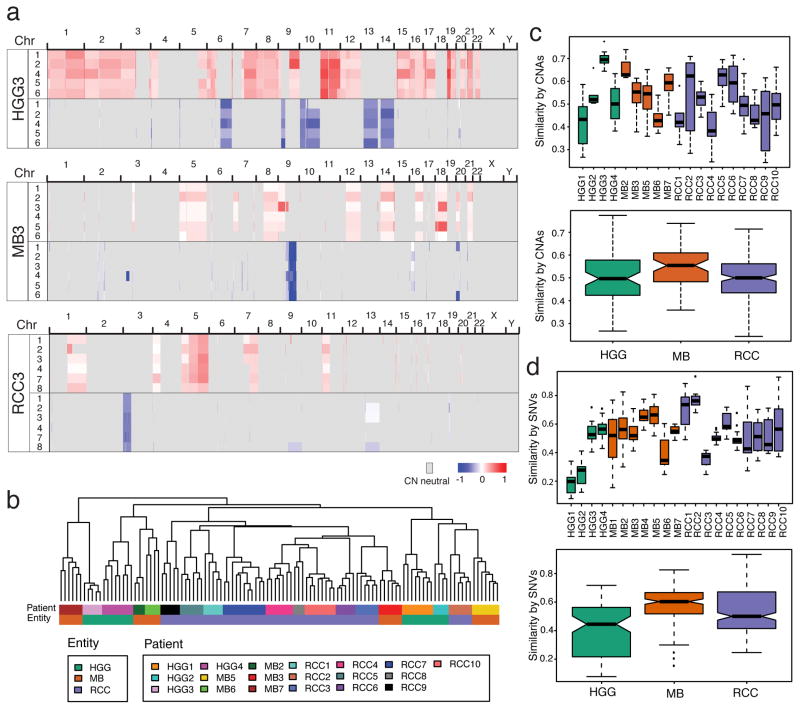
Figure 2. Variable intra-tumoral heterogeneity of somatic aberrations in all tumor entities.
Genome wide analysis of copy number aberrations does not recapitulate the striking expression-based spatial homogeneity of MBs. (a) Copy number segments of gain (red) or loss (blue) are shown across the genome of three individual patients for each biopsy. (b) Unsupervised HCL of copy number segments show tight clustering of individual biopsies across all tumors in the cohort. Intra-tumoral heterogeneity measured from CNA’s (c) or SNVs (d), both in individual patients (top panels) and summarized by entity (lower panels) shows that tumors in all entities range from high spatial similarity (e.g. HGG3, MB2) to low (e.g. HGG1, RCC3). Similarity is measured as the binary distance between all pairs of tumor-matched biopsies.

