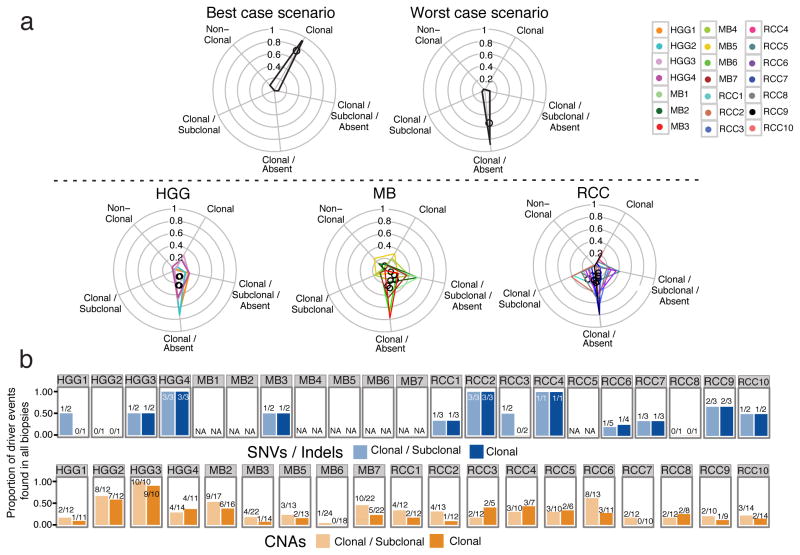
Figure 4. Genetically distinct clonal lineages yield ON/OFF mutation patterns between spatially separated biopsies.
(a) Non-synonymous mutations are binned into 5 categories: those clonal in all biopsies (Clonal); clonal in some biopsies and sub-clonal in others (Clonal/Subclonal); clonal in some biopsies and completely absent in others (Clonal/Absent); clonal in some biopsies, sub-clonal in others, and absent in others (Clonal/Subclonal/Absent); and those never detected as clonal (Non-Clonal). Upper panel: illustration of the most favorable clinical scenario in which most mutations are clonal across all biopsies (left), and the worst-case scenario where mutations are clonal in some biopsies but absent in others (right). Lower panel: Mutation patterns follow a worst-case scenario across tumor types. Tumor-specific polygons on radial plots indicate the proportion of mutations on each of the 5 axes, with polygon centers marked by a black circle. (b) Barplots of the proportion of driver mutations/indels (top panel) or CNAs (lower panel) that are found in every biopsy of a given tumor (i.e. trunk events) when considering the clonal and subclonal or only clonal driver events. The absolute numbers are shown above the bars.

