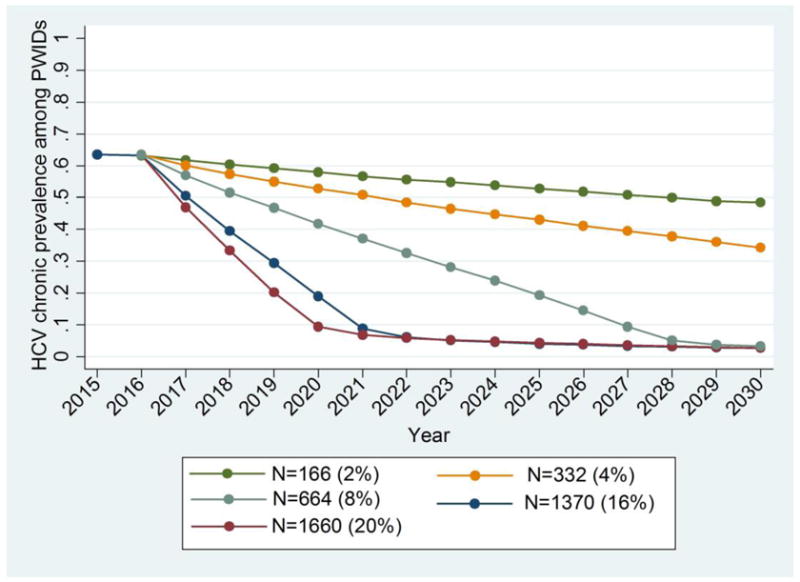
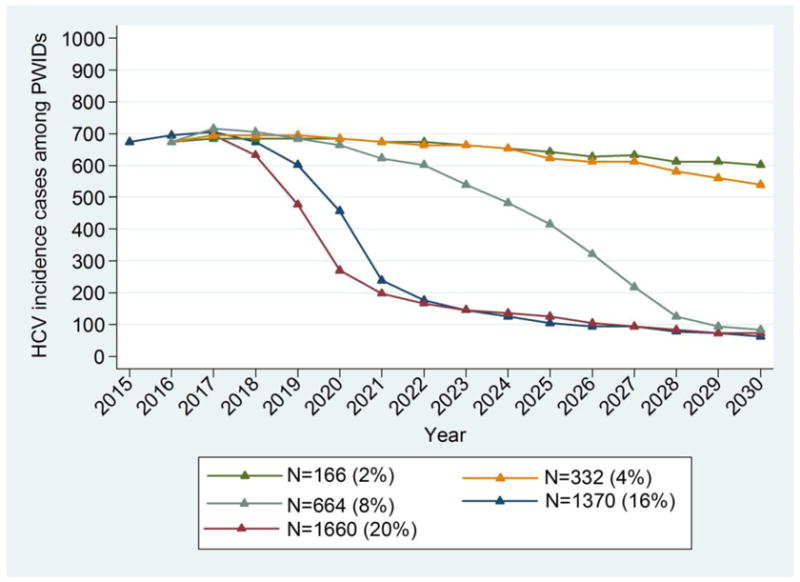
Figure 2.


Model predictions for chronic HCV prevalence and the number of new infections among PWID in Athens for different annual treatment rates (N) while assuming 2% annual increase in harm reduction programmes coverage (from 44% in 2015 to 72% in 2030). The number of treated PWID per year and the corresponding percentage over the whole population of PWID in Athens are shown in parentheses.
a. Chronic HCV Prevalence among PWID
b. New infections among PWID
