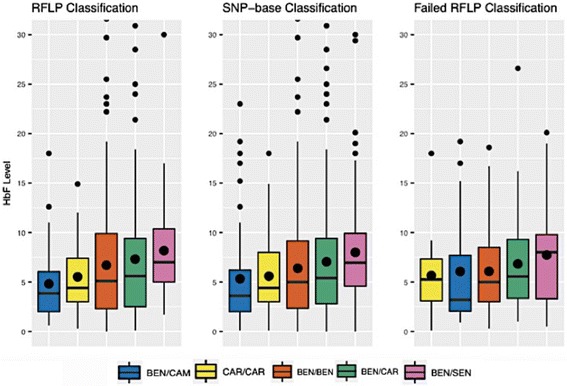
Fig. 2.

Boxplots of the Common Haplotypes in the CSSCD. Shown are the HbF levels according to haplotype defined by RFLPs and SNP-based methodology. The third panel shows data from patients not classified by RFLP but successfully classified using the SNP-based method. The black dots in the middle of the boxplots represent mean HbF level, while the black horizontal lines represent the median HbF level
