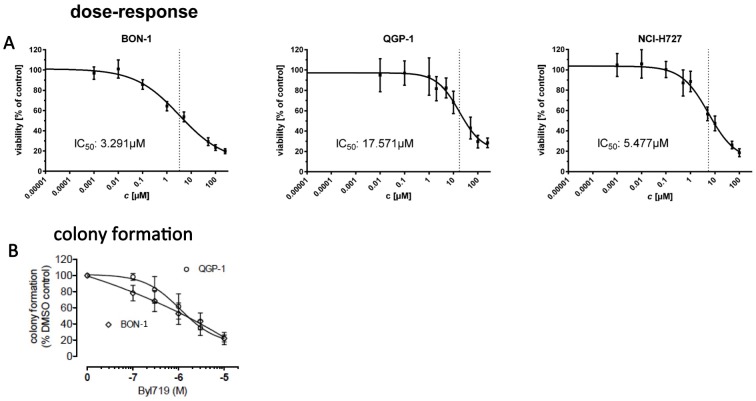
Fig 1.
A: We treated cell lines with 9 different concentrations of BYL719 or vehicle control for 96 h and assessed cell viability with the WST-1 assay (Roche). Viability of treated cells was stated in percent vs. control (mean ± standard deviation (SD)). Dose-response curves and IC50 were calculated with GraphPad Prism software. B: In BON-1 and QGP-1 cells, colony formation was dose dependently reduced down to 22% of vehicel controls, with IC50 values of 1,3 μM and 1,8 μM, respectively. Data are presented as mean±SD of at least three independent experiments with five replicates per data point.

