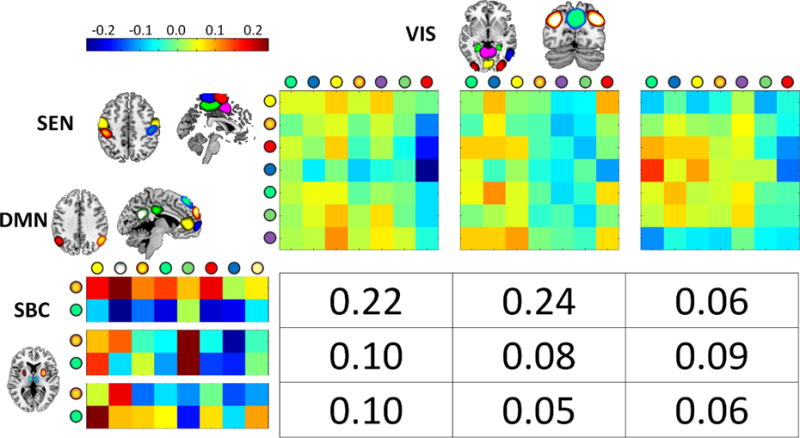
Fig. 6.

Displayed result was selected from the set that showed significant relationships with considered covariant. The cross domain information for SBC-DMN vs. SEN-VIS (mean I=0.06) showed significant increment with age (beta = 0.0063 and p=0.0018). The circles on the state centroids axis designate the brain region displayed. The two joint probabilities 0.22 and 0.24 drive the cross information measure since both are similarly larger than the rest.
