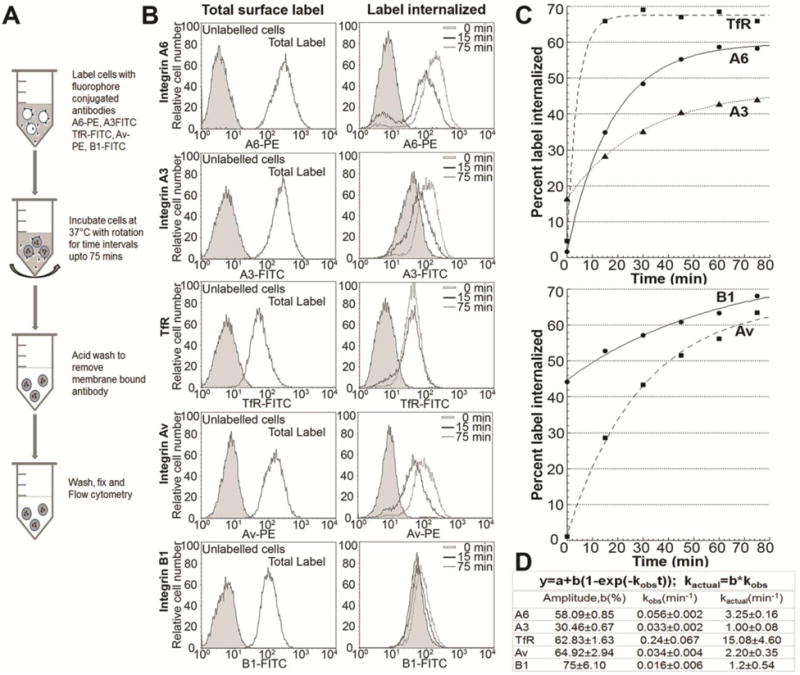
Figure 1. Internalization kinetics of integrin subunits and transferrin receptor.

[A] Schematic representation of the internalization assay. DU145 cells were surface labelled with fluorophore conjugated antibodies against integrin subunits α6 (A6-PE), α3 (A3-FITC), αv (Av-PE), β1 (B1-FITC), or transferrin receptor (TfR-FITC) at 4°C for 1 hr. followed by internalization at 37°C for different time intervals. Remaining surface label was removed and cells were fixed and analyzed by flow cytometry. [B] Flow histograms of receptor internalization. Left panel shows total surface levels of the indicated receptor and unlabeled cells (shaded) are shown as control. Right panel shows histogram profile of the labelled receptor internalized at representative time intervals showing increase in mean peak fluorescence with increase in time of internalization. [C] Internalization curve of the receptors. Percent of label internalized (calculated as percent mean peak fluorescence of internalized label at a given time point versus total surface label) is plotted against time of internalization. First order curve is fitted using Kaleidagraph (R2>0.98). [D] Parameters of internalization kinetics: maximum intracellular accumulation (amplitude, b) and internalization rate constants (observed, kobs and actual, kactual) calculated using first order rate kinetics. Histograms and kinetic curves are representative of at least 3 independent experiments.
