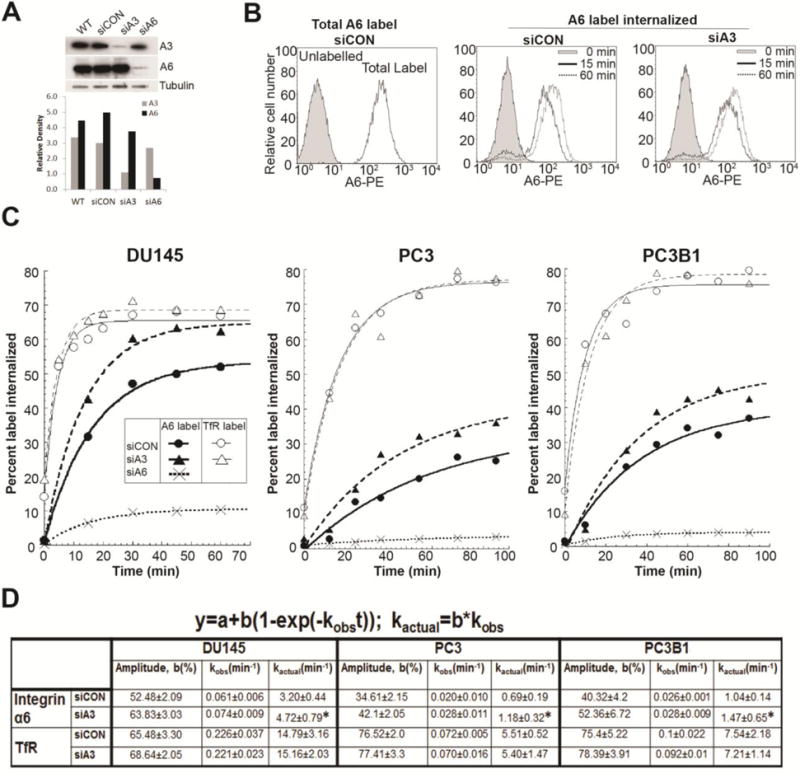
Figure 2. Internalization of integrin α6 after silencing integrin α3 expression.

DU145, PC3 or PC3B1 cells were transfected with non-targeting siRNA (SiCON), siRNA against α3 integrin (siA3), or α6 integrin (siA6). [A] Immunoblot showing integrin α6 (AA6NT) and integrin α3 (AB1920) expression in untreated (WT), siCON, siA3, siA6 DU145 cells. [B] Internalization assay for integrin α6 and TfR were performed on siCON and siA3 cells. Flow histogram of total labelled integrin α6 at the surface and amount internalized at different time intervals in siCON and siA3 treated DU145 cells. [C] Internalization curve of α6 integrin (A6) in siCON, siA3, and siA6 cells and transferrin receptor (TfR) in siCON, siA3 treated DU145, PC3 and PC3B1 cells. Percent label internalized was calculated and first order kinetic curve was fitted as previously described in figure 1. [D] Maximum intracellular accumulation (amplitude, b) and internalization rate constants (observed, kobs and actual, kactual) calculated as per first order rate kinetics. Results represent 4 independent experiments. Statistical significance calculated for change in kactual of siA3 versus siCON cells as per student’s t test, unpaired, *p < 0.05, n = 4.
