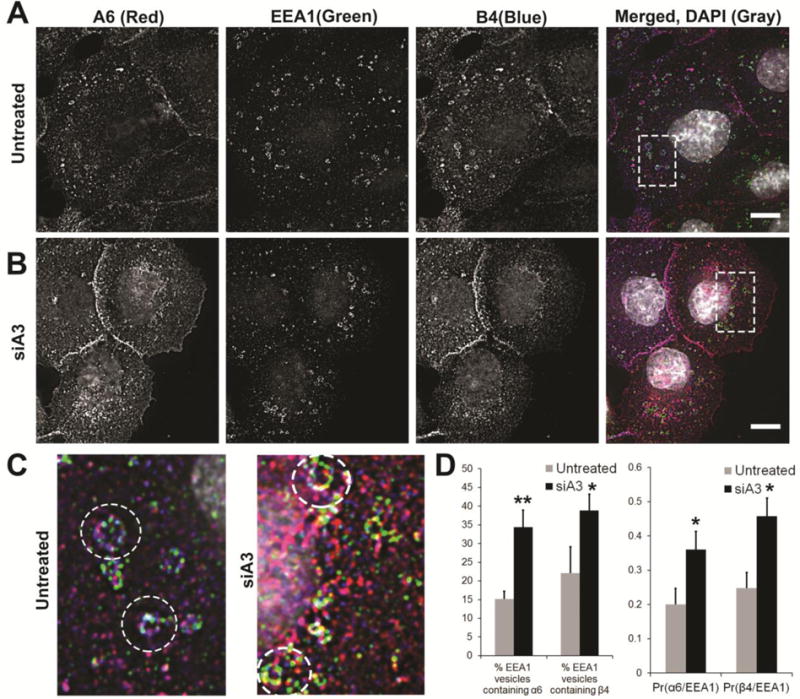
Figure 7. Distribution of α6β4 integrin in early endosomes on silencing α3 integrin expression.

Surface α6 integrin was labelled with J1B5 and β4 integrin with ASC3 antibody in DU145 cells and allowed to internalize for 40 minutes in the presence of primaquine (a recycling inhibitor) to achieve maximum intracellular accumulation. Cells were fixed, permeabilized, and immunostained for markers of intracellular vesicular compartments. [A] Untreated DU145 cells, [B] siA3 treated cells. Integrin α6 (A6, red), early endosome antigen 1 (EEA1) positive early endosomes (green), integrin β4 (B4, blue) and DAPI (gray) in merged image. Images acquired by confocal microscopy. [C] Magnified images of boxed sections are shown for untreated and siA3 treated DU145 cells. [D] Percent EEA1 vesicles containing α6 or β4 integrin and mean Pearson coefficient of correlation of α6 integrin with EEA1 (Pr(α6/EEA1) or β4 with Lamp1(α6/EEA1) are reported for untreated or siA3 treated cells based on 10 different field of view in 3 independent experiments (*p < 0.05 **p < 0.005). Bars, 10μm.
