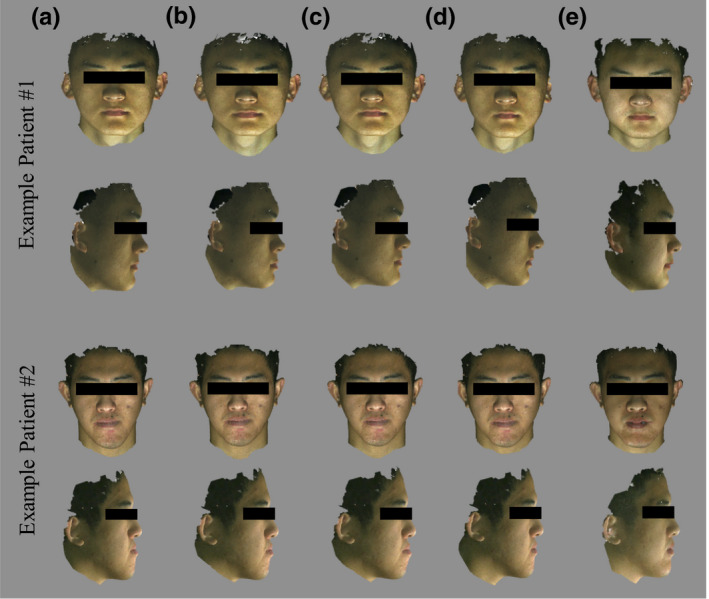
Figure 5.

Randomly selected two examples of simulated results with color texture mapped. The top row shows the frontal view while the bottom row shows the right view for each example patient. (a) Preoperative soft tissue. (b) Predicted soft‐tissue change using Method #1. (c) Predicted soft‐tissue change using Method #2. (d) Predicted soft‐tissue change using Method #3, our complete 3‐stage approach. (e) The actual postoperative soft tissue. For the Example Patient #1, the quantitative analysis showed 7.8 and 6.5 mm of maximum displacement error for Methods #1 and #2 in the chin region, respectively, while that of Method #3 was 1.0 mm. However, the upper and lower lip relationship resulted from the Method #3 was only getting similar to the actual postoperative lip relationship, even though the quantitative error was significantly improved. For the Example Patient #2, the quantitative analysis showed 3.6 and 5.3 mm of maximum displacement error for Methods #1 and #2 in the lower lip region, respectively, while that of Method #3 was 3.2 mm. The result achieved with Method #3 is the only one showing correct upper and lower lip relationship comparing to the actual postoperative soft tissue, even though the quantitative improvement was not significant. [Color figure can be viewed at wileyonlinelibrary.com]
