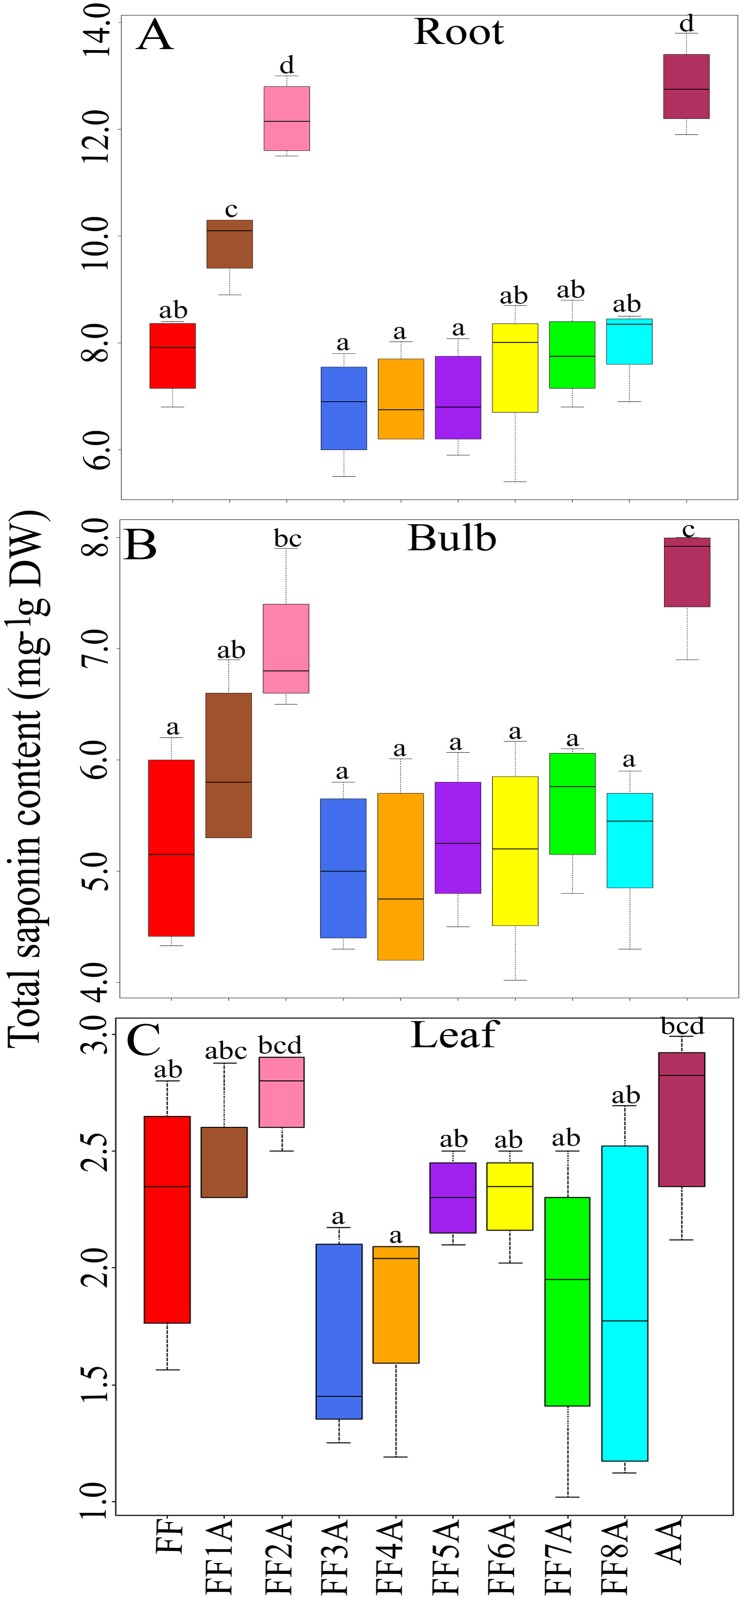
Fig 2. Box plot diagram showing the changes in (A) root, (B) bulb (C) and leaf saponin contents (mg g−1 DW) in Allium cepa Aggregatum group (AA), monosomic addition lines (MALs = FF1A, FF2A, FF3A, FF4A, FF5A, FF6A, FF7A, and FF8A) and A. fistulosum (FF).
Values represent the maximum, third quartile, median, first quartile and minimum of three independent replicates (n = 3). Different letters indicate statistically significant difference at P < 0.05 according to Tukey’s honest significant difference (HSD) post-hoc test.

