
Figure 8.
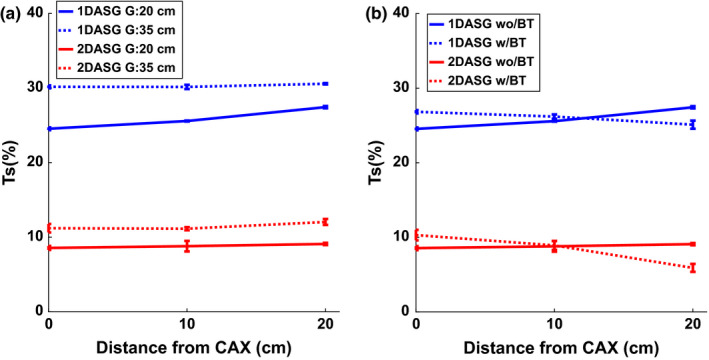
(a) TS at different air gaps were plotted at all 3 measurement points. (b) TS measured with and without BT filter. [Color figure can be viewed at wileyonlinelibrary.com]
Official websites use .gov
A
.gov website belongs to an official
government organization in the United States.
Secure .gov websites use HTTPS
A lock (
) or https:// means you've safely
connected to the .gov website. Share sensitive
information only on official, secure websites.
(a) TS at different air gaps were plotted at all 3 measurement points. (b) TS measured with and without BT filter. [Color figure can be viewed at wileyonlinelibrary.com]