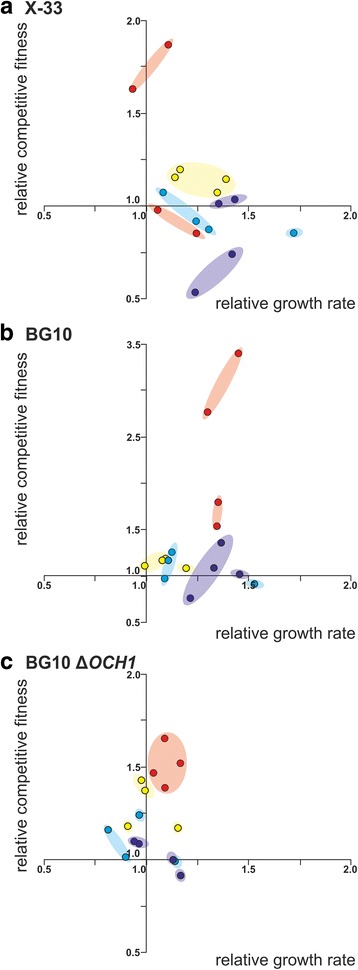
Fig. 2.

Correlation of growth rates and competitive fitness of evolved heterogeneous P. pastoris populations in adaptive conditions. Growth rate (x-axis) and competitive fitness (y-axis) relative to the ancestral strains. a P. pastoris X-33, (b) BG10 and (c) and BG10 ∆OCH1. Circles represent individual evolved populations adapted to YPD (yellow), YPDN (red), BMD (light blue) and BMDN (dark blue) growth conditions
