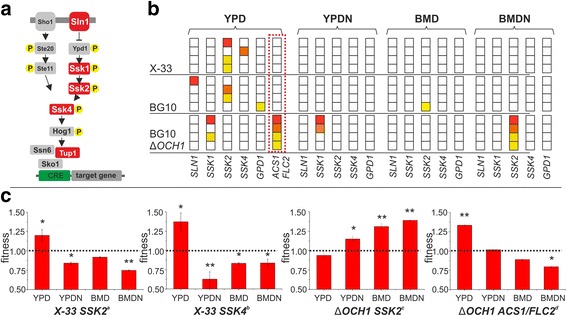
Fig. 5.

Osmotic stress-related adaptive mutations. a High osmolarity glycerol (HOG) MAPK signaling pathway (b) Mutations of HOG pathway related genes in the evolved P. pastoris clones isolated from independent populations. Mutations are grouped by their appearance in strain background and growth condition. For each growth condition the affected genes are shown. The four clones for each condition are represented by squares. The occurrence of a particular mutation is indicated by color (yellow to red for the presence of a mutation in each individual clone). A blank square indicates the absence of a mutation. Non-HOG-related mutations (ACS1/FLC2) in ∆OCH1 clones are highlighted by a dashed box. (c) Fitness of clones with a single HOG-related or ACS1/FLC2-related mutation (a-d, as described in Tables S13-S15). Values represent averages +/− standard deviation of n = 4; paired Student’s T-test values * p ≤ 0.05, ** p ≤ 0.01
