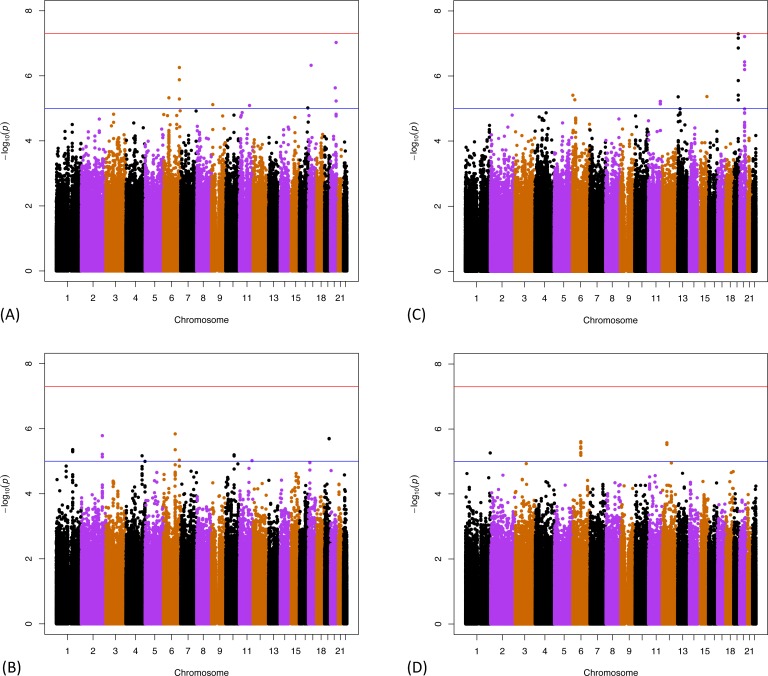
Fig 2. P-values for all 1,198,956 SNP associations from GWAS on the HRS genetic sample.
(A) Level of Immediate Recall (IR-L); (B) Change in Immediate Recall (IR-C); (C) Level of Residualized Delayed Recall (rDR-L); (D) Change in Residualized Delayed Recall (rDR-C). For these figures, the upper (red) horizontal line demarcates the threshold of p = -log(5.0x10-08) and the lower (blue) horizontal line demarcates p = -log(1x10-05). SNPs are arranged by their chromosomal position (x-axis).

