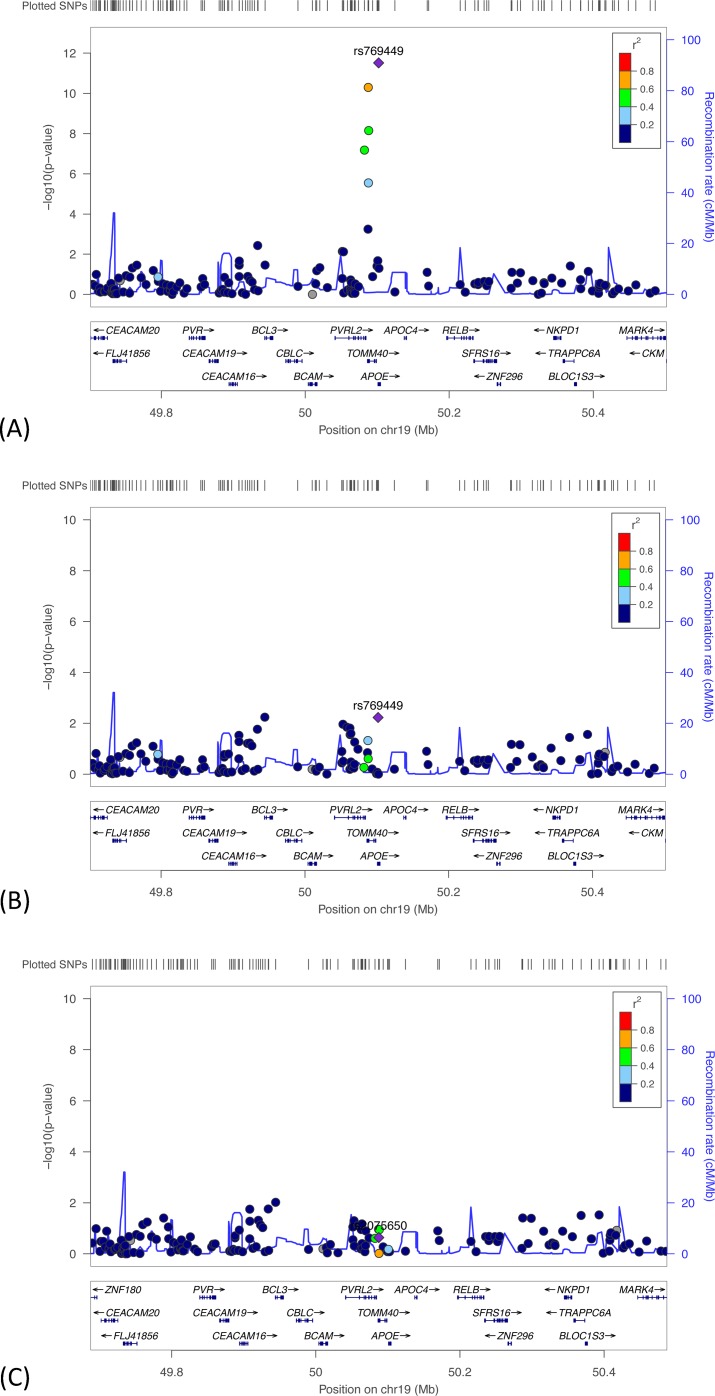
Fig 4. Regional plots showing meta-analyses results for rDR-L.
(A) Results with the top associated SNP in the APOE region labeled. Two conditional meta-analyses were performed for rDR-L, (B) estimating the association with the APOE SNP shown (rs769449), conditioning on the top TOMM40 SNP (rs2075650); and (C) estimating the association with the TOMM40 SNP shown (rs2075650), conditioning on the top APOE SNP (rs769449). The y-axis shows -log10 P-values; x-axis shows position of genes on chromosome 19 with SNPs 400-kb in both directions of the SNP of interest. The diamond represents the top SNP of interest. The circles represent each genotyped SNP in this region; the circle color indicates pairwise linkage disequilibrium (LD) in relation to the top SNP (calculated from hg19/1000 Genomes Nov 2014 EUR). The solid (blue) line indicates the recombination rate.

