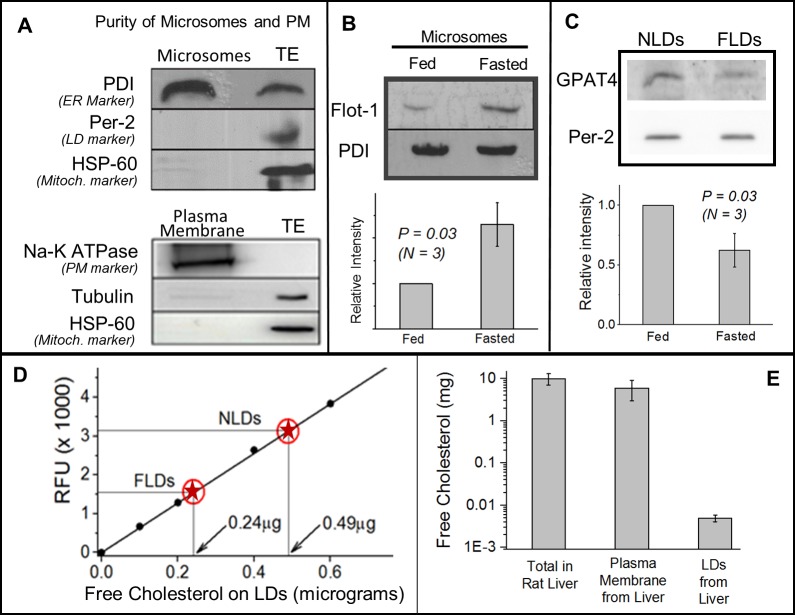
Fig 2. Feeding-fasting dependent changes in flotillin-1, GPAT4 and free cholesterol (FC) on LDs and ER-enriched microsomes.
(A) Upper panel The microsome fraction isolated from normally fed rat liver is enriched in PDI (ER marker). Mitochondrial marker (HSP-60) and LD marker (perilipin-2) are not detected on the microsomes. Liver tissue extract (TE) with equal amount of protein as microsomes was loaded. Lower panel A membrane fraction isolated from normally fed liver is enriched in the plasma membrane marker (Na-K ATPase). No cytosolic or mitochondrial contamination is detected. (B) Flotillin-1 levels increase on the microsome fraction in fasted liver as compared to fed state. Western blotting against PDI (ER marker) shows equal loading of the ER samples. This experiment was repeated with consistent results on three pairs of fed and fasted animals. Error bars are SEM. (C) GPAT4 localisation on LDs decreases after fasting. Western blotting using anti-GPAT4 antibody shows higher level on NLDs as compared to FLDs. Equal amount of NLD and FLD samples was loaded, as determined from equal intensity of perilipin-2 band on these samples. This experiment was repeated on three pairs of fed and fasted animals, yielding similar results. Error bars are SEM. (D) Measurement of free cholesterol (FC) by a fluorimetric method. Y-axis denotes relative fluorescence units (RFU). Known amounts of cholesterol standards (filled circles) were used to build a calibration curve (straight line). The RFU value was then measured for NLDs and FLDs (red circles with star). The corresponding amount of FC in these samples was then read off from the calibration curve (shown in graph). This measurement shows two-fold more FC in NLDs as compared to FLDs. Equal NLD and FLD samples were loaded, as determined from equal TG amounts in the samples in TLC experiments. Duplicates of all the samples were used for the assay. This experiment was repeated twice with similar results (using two pairs of animals). (E) Estimation of free cholesterol in whole rat liver tissue extract, plasma membranes from rat liver, and LDs purified from rat liver. Liver of normally fed rats were used. Note the logarithmic scale on Y axis. Crude liver tissue extract sample was prepared from a known mass of liver tissue, and a TLC experiment was run with this sample, along with known dilutions of FC as standards (not shown). The best match was used to estimate total amount of FC in the liver extract sample (N = 3). Similarly, PM and LDs were prepared and comparison was done with FC standards in a TLC experiment. The total FC on PM and LDs was then estimated for the whole liver (see methods).

